| Image | Thoughts | Further Interrogation | |
|---|---|---|---|
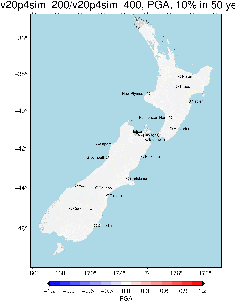
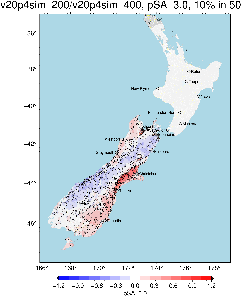
| South island comparison for 200m (cs 20p6 + cs 20p5 + ds) vs 400m (cs 20p4 + cs 20p5 + ds) |
| No HF differences, despite re-run (different seed) and slightly larger domains. | None needed |
| pSA 3.0 was HF in 400m and LF in 200m Basins in canterbury, malborough and nelson show increased IM level. Red is southland / Westcoast? General blue closer to main hazard? | Zoomed in plots in basin areas? | |
| pSA 5.0 is LF in both 400m and 200m General increase in this IM across whole SI | ||
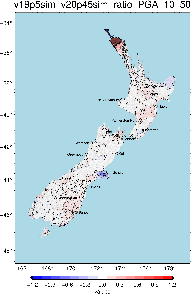
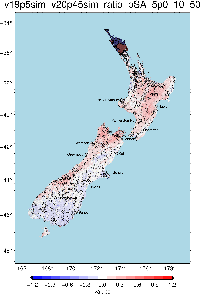
19p5 (CS19p5 + subduction sampling + txt based empirical) vs v20p4 (CS20p4 + CS20p5 + DS (Bradley + BC Hydro)) |
| DS model for Christchurch updated for the increased aftershock probabilities | Zoomed in Chch? |
| Waikato Basin introduced in 20p4 (increased in these areas) Hikurangi changed to simulation (decreased) | Zoomed basin plot? | |
| Further plots? Empirical vs 20p4? |

Overview
Content Tools
Activity