| Image | Thoughts | Further Interrogation | |
|---|---|---|---|
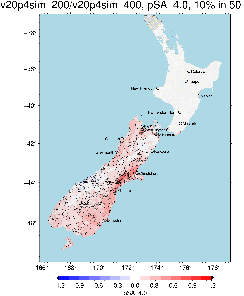
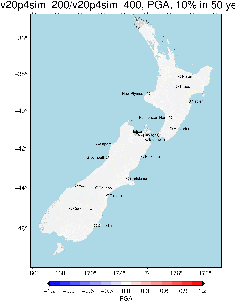
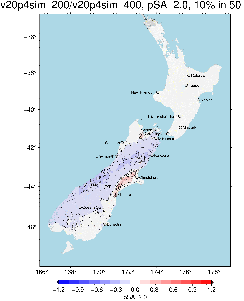
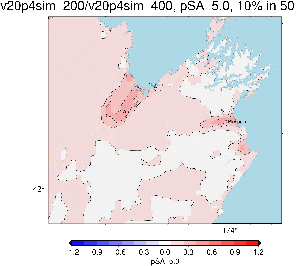
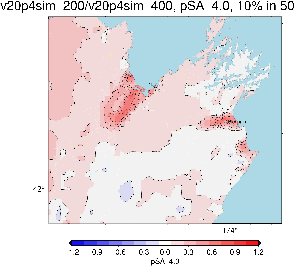
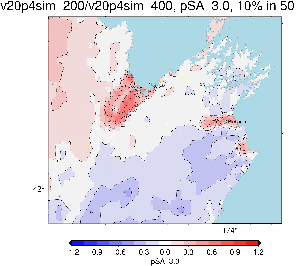
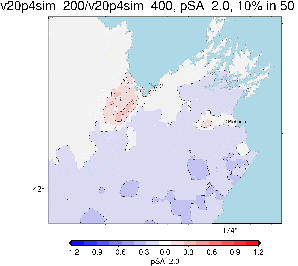
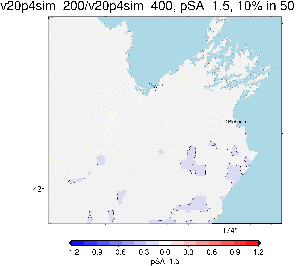
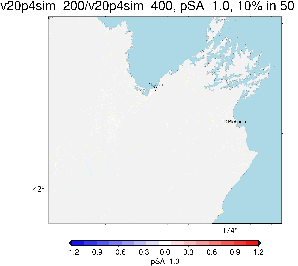
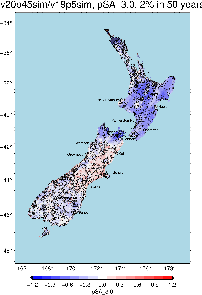
| South island comparison for 200m (cs 20p6 + cs 20p5 + ds) vs 400m (cs 20p4 + cs 20p5 + ds) |
| No notable HF differences (given the color bar discretization), despite re-run (different seed) and slightly larger domains. | None needed |
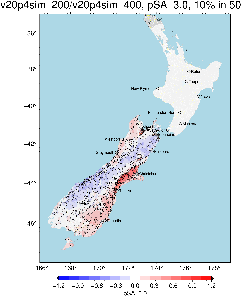
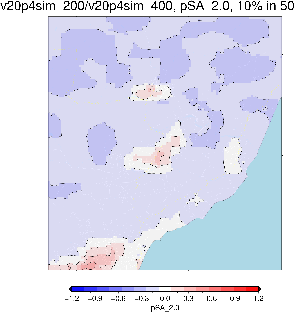
| pSA 3.0 was HF in 400m and LF in 200m Basins in canterbury, malborough and nelson show increased IM level. Red is southland / Westcoast? (Ethans comment, no basins in the sims here) (Ethan's comment, as pSA 3.0 was HF in one sim and LF in the other, the trend shows that the LF sim results in a lower hazard following the alpine range in the SI, while in general the LF has a higher hazard in Canterbury and other modelled basins. This is due to basin amplification at in these regions (the HF sim is simplified physics and does not amplify these frequencies like the LF sim does. In summary, the blue down the spine is more due to the difference between HF and LF sim techniques (B: specifically around the rock areas) and not the location of the hazard, while the red in the basins is due to the LF sim amplifying specific wave frequencies in these regions) BB comment: Keep in mind that the HF sim is, strictly speaking, only intended for the portion of the ground motion that lacks coherence (globally accepted to be f<1Hz), so its use for f up to 4Hz is a big assumption; even 2Hz is an assumption (for newer runs), but still incremental improvement. | Zoomed in plots in basin areas. Can probably plot Waiau, Cheviot and Hanmer basin regions on a single plot, Marlborough and Nelson also in close proximity (approx region shown in figure) IMs at the transition frequency will show the most variability. pSA1.0-5.0, PGV (others useful to look at though) | |
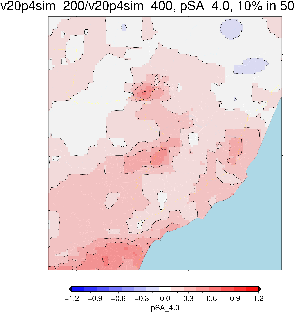
| pSA over transition frequency |
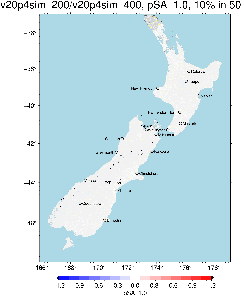
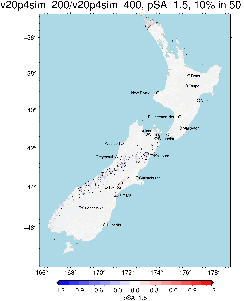
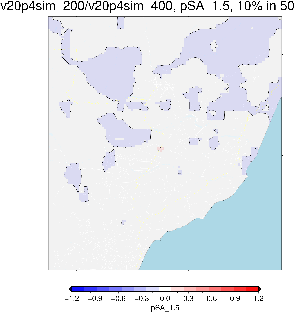
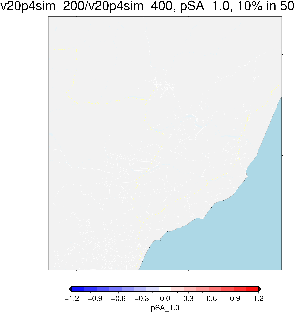
| As with the figure above, for pSA3.0, the effects seen here are consistent with the notion that differences occur over the f=2-4Hz range, due to the different transition frequencies (4hz and 2hz for 400m and 200m, resp.), with a 'tapering' of the effects 'away' from this (i.e. for f~1-2Hz and f~4-6Hz, for example). | |
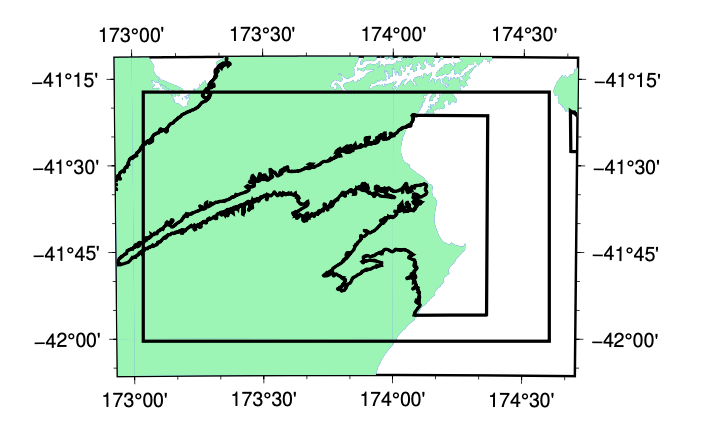
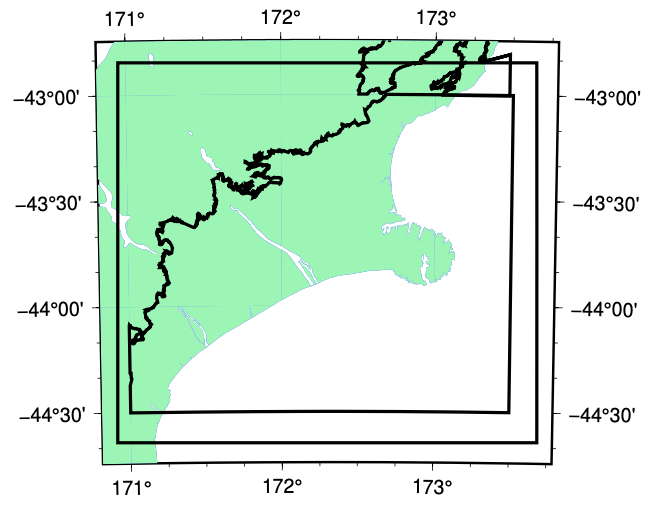
| Cheviot / Hanmer / Waiau |
| ||
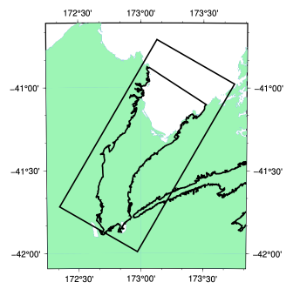
Marlborough / Nelson |
| ||
| Christchurch | |||
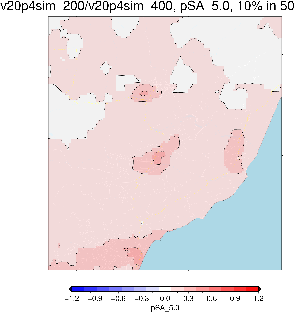
| pSA 5.0 is LF in both 400m and 200m General increase in this IM across whole SI | ||
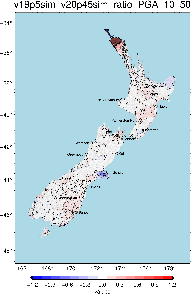
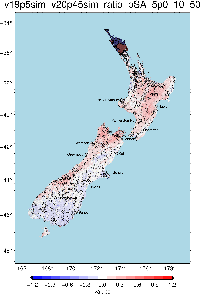
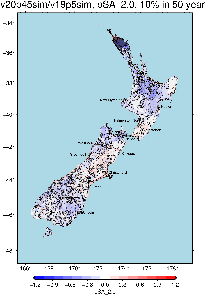
19p5 (CS19p5 + subduction sampling + txt based empirical) vs v20p4 (CS20p4 + CS20p5 + DS (Bradley + BC Hydro)) |
| DS model for Christchurch updated for the increased aftershock probabilities | Zoomed in Chch / Banks Peninsula (can see a trend in this region) IMs of interest pSA < 2s, PGA, PGV as DS expected to have larger influence on HF - useful to see all IMs though. |
| Waikato Basin introduced in 20p4 (increased in these areas) Hikurangi changed to simulation (decreased) | 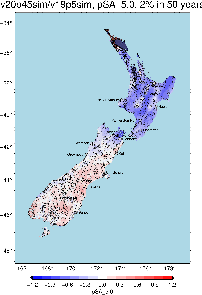 | |
| 2% in 50y |
| ||
| 10% in 50y | 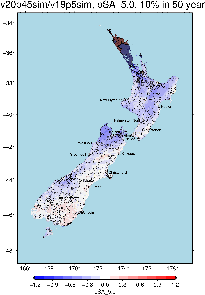 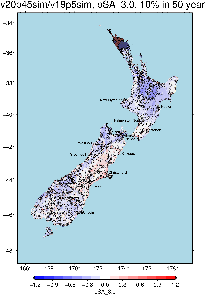
| ||
| Christchurch |
| ||
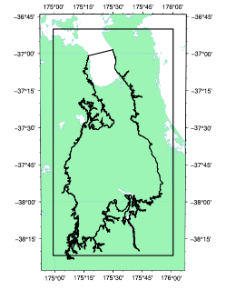
| Waikato |
| ||
| General guide to the locations of basins characterized in the NZVM. Basin boundary text files can be found in https://github.com/ucgmsim/Velocity-Model/tree/development/Data | ||
| Further plots? Empirical vs 20p4? | Not sure if this is necessary. I think we are targeting identifying the differences between cybershake versions (if its easy to do this then emp vs sim for all the basins would be good to look at also) |


Overview
Content Tools
Activity