Update on SeisFinder Implementation:
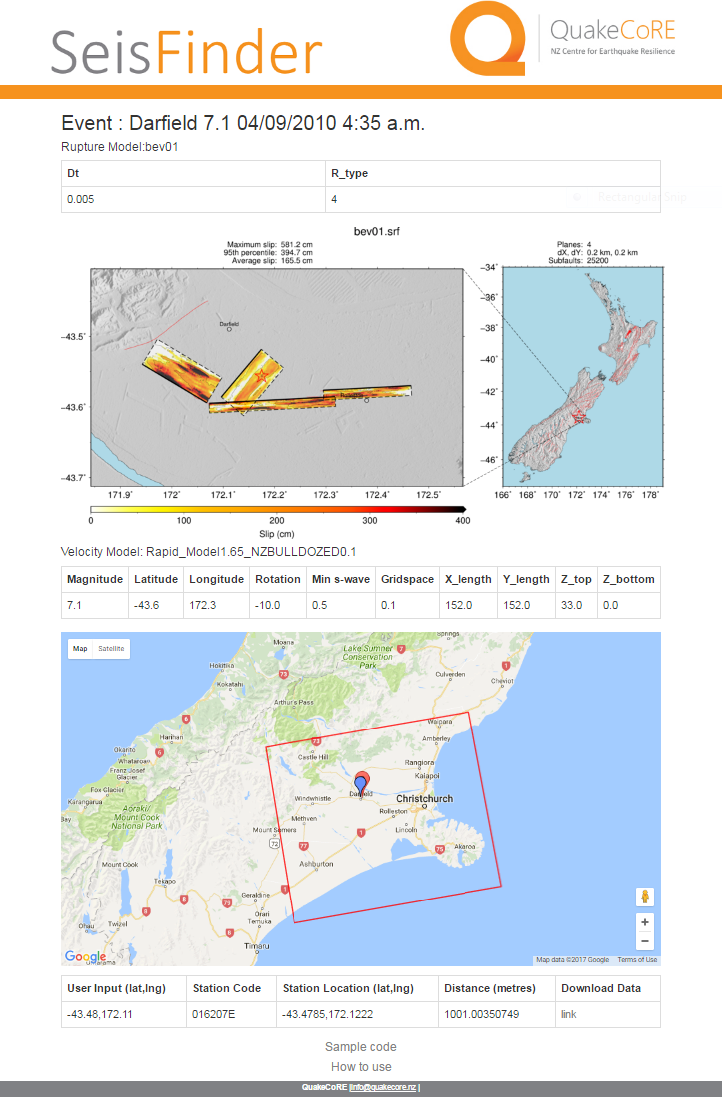
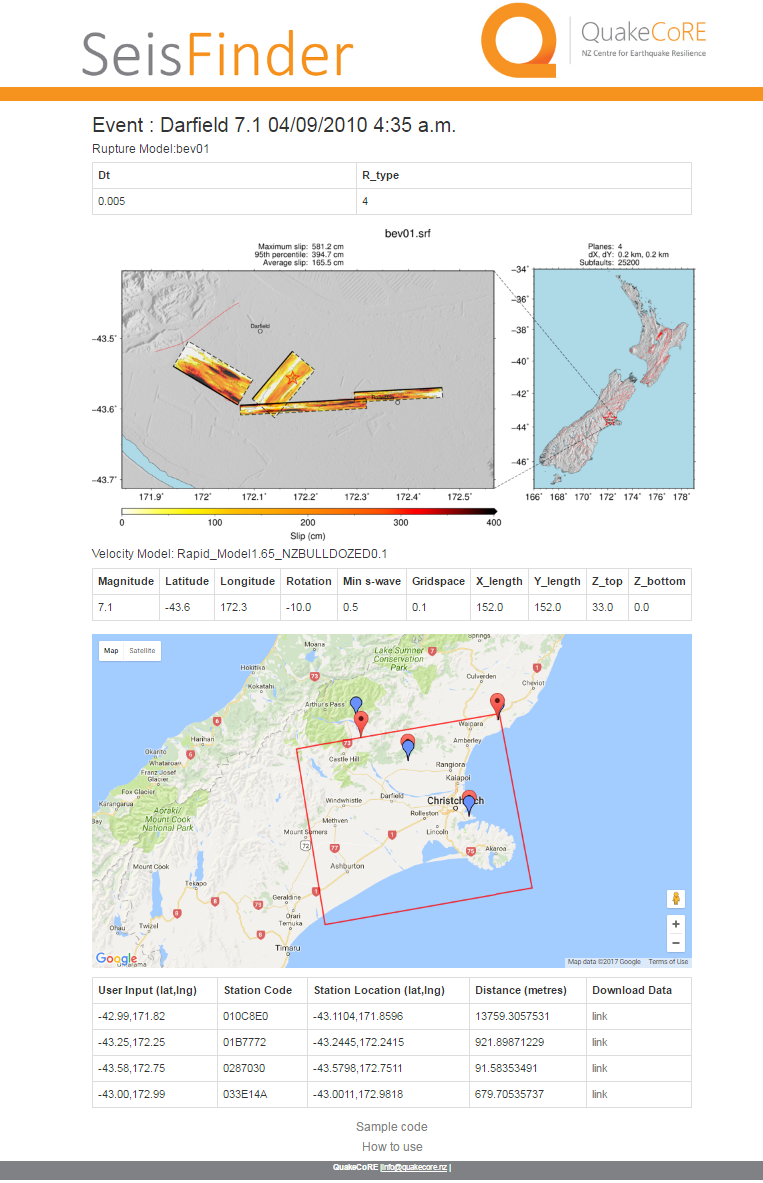
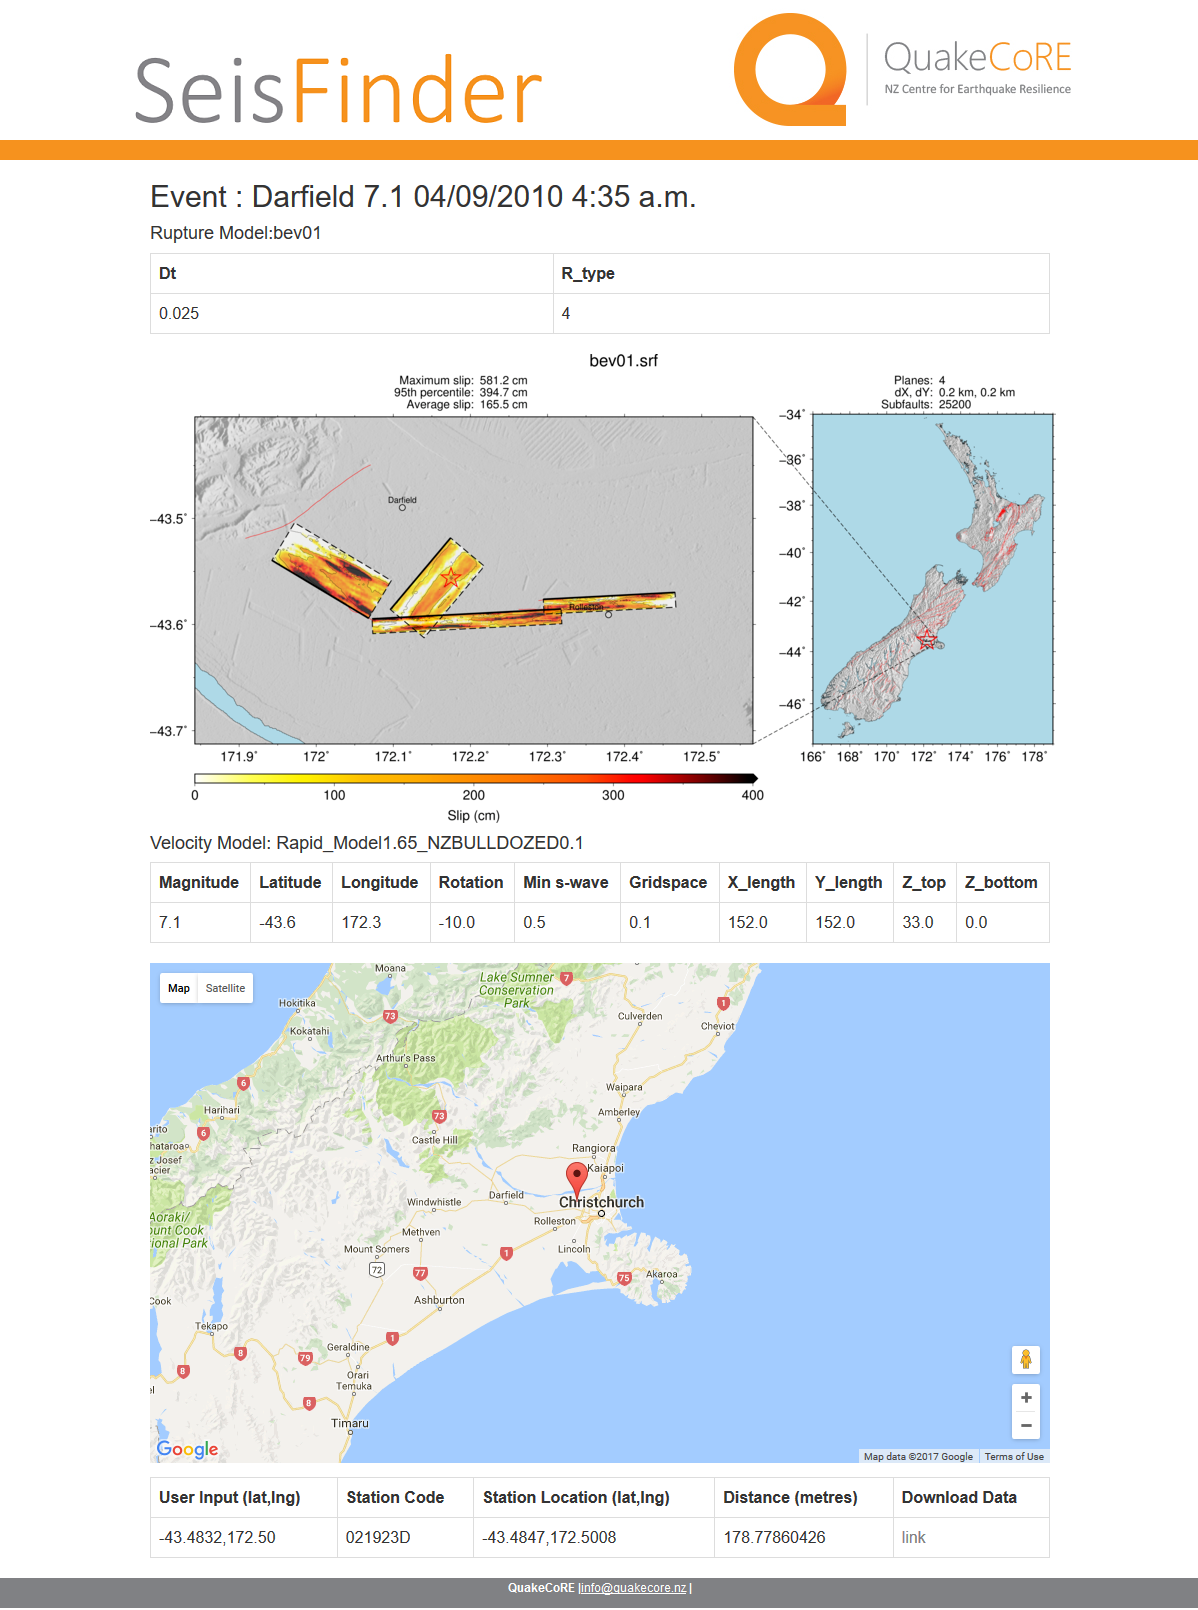
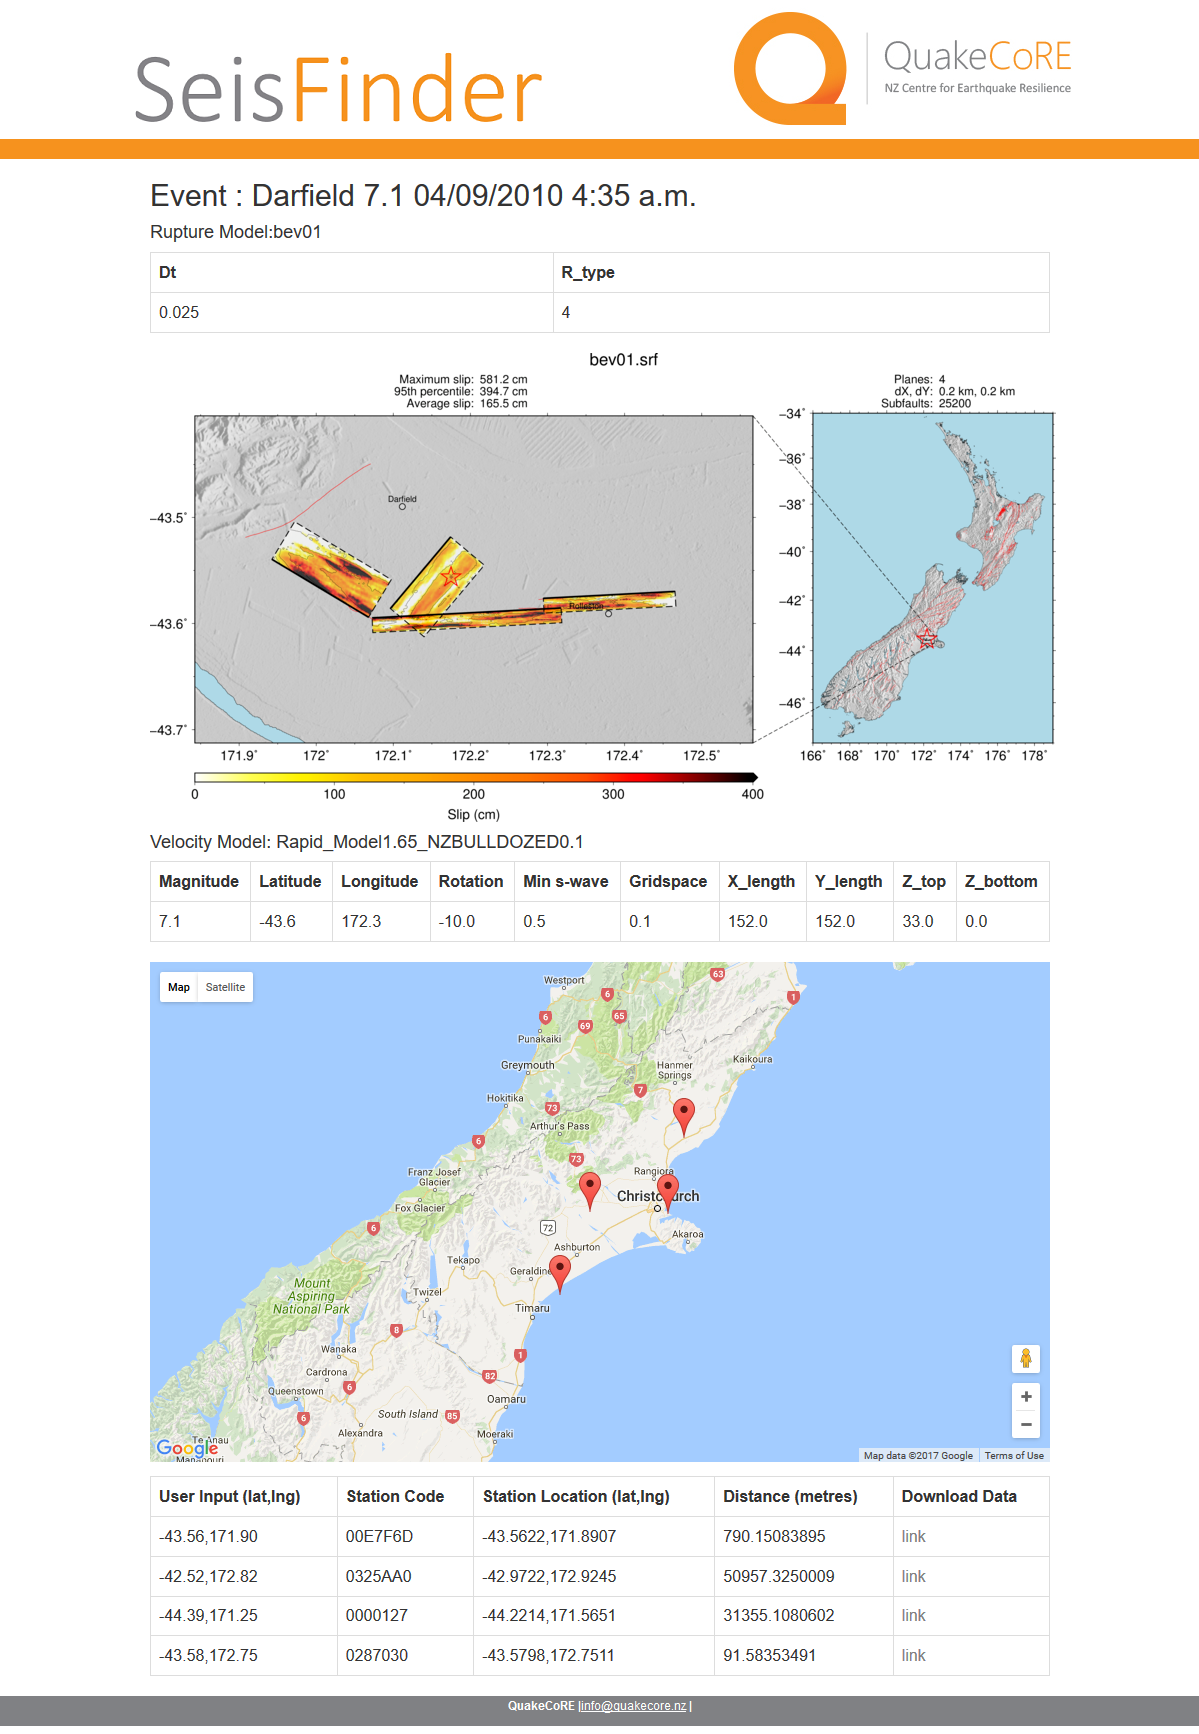
Domain is represented in a rectangle in google maps. The user will be able to see whether the input location is within the domain and also the distance between his input and the actual station. In the map, user inputs are represented in blue markers and the station locations are represented in red markers.
Screenshots
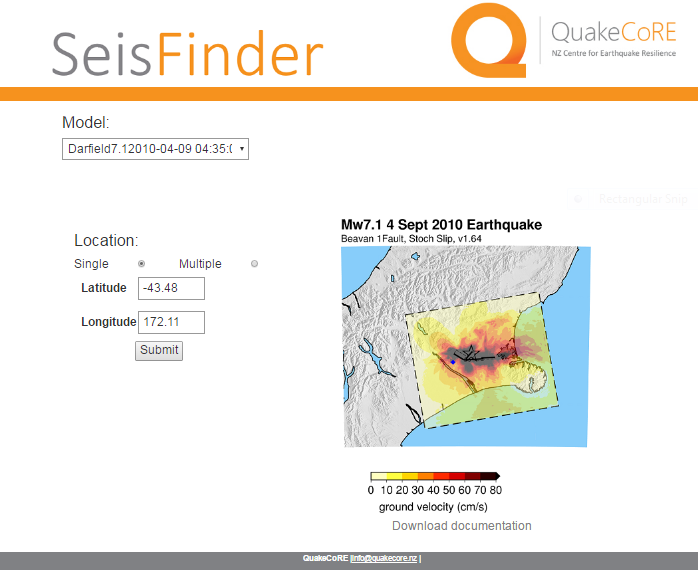
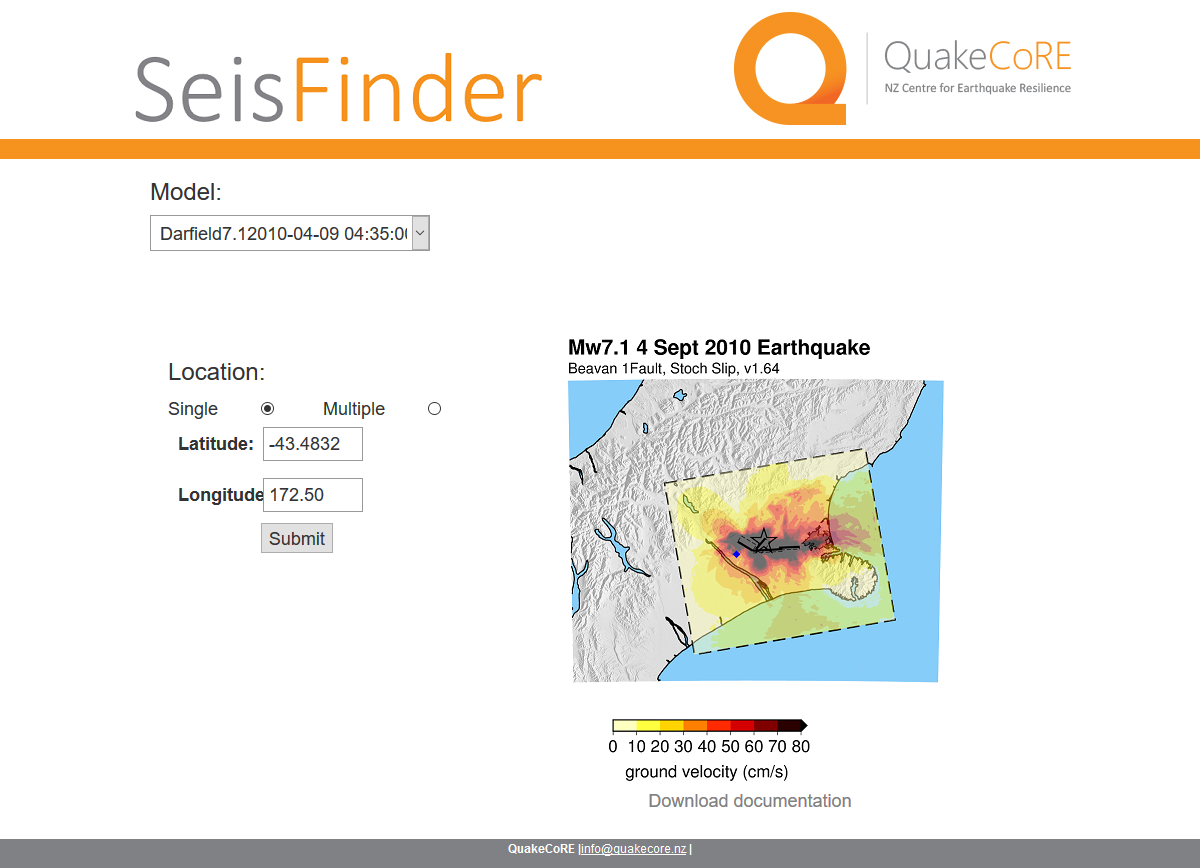
Single location
Input
Output
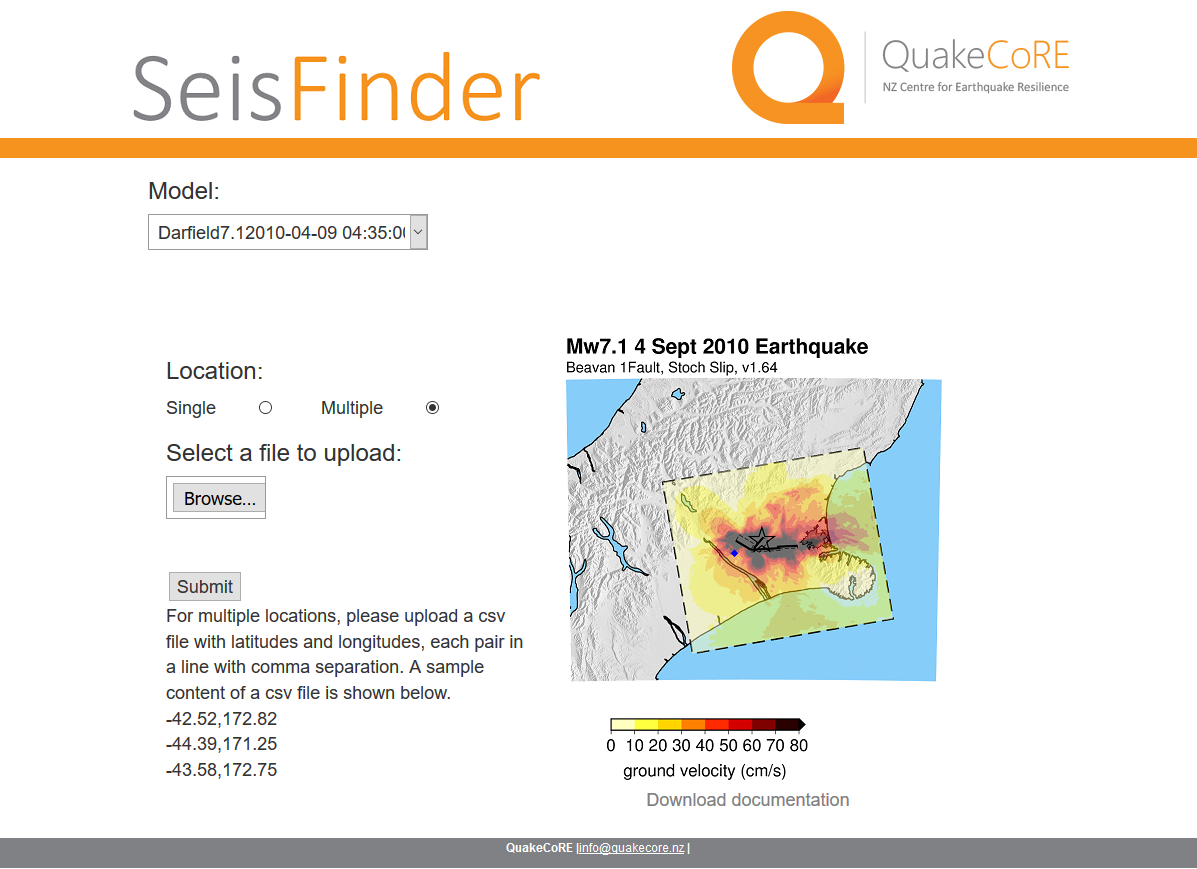
Multiple location
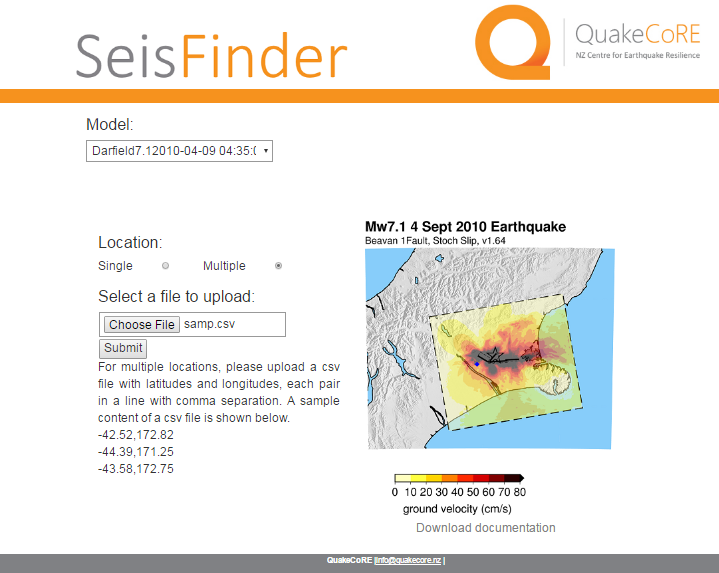
Input
Output
Update on SeisFinder Implementation:
- Input options
- multiple inputs by uploading a file (done)
- input though google maps (In current design,input location can be viewed/located in google maps, but the input is not through google maps by clicking)
- Add feature for below surface ground motion simulation (does not support this feature yet)
- Add feature to show slip model of fault as image (done)
SeisFinder currently supports both single and multiple location inputs.
- It can accept single input (latitude,longitude) and output a data file for download in zip format.
- It can also take multiple inputs (uploaded in a CSV file) and output data files for download in zip format.
- It can also show slip model of fault as image along with rupture and velocity model information.
Screenshots
Single location
Input
Output
Multiple locations
Input
Output
SeisFinder currently accepts single input (latitude,longitude) and outputs a zip file (for download).
Further we will add the following features:
- Input options
- multiple inputs by uploading a file
- input though google maps
- Add feature for below surface ground motion simulation
- Add feature to show slip model of fault as image