...
| Expand | ||||||||||||
|---|---|---|---|---|---|---|---|---|---|---|---|---|
| ||||||||||||
Verification of deformationUsing a function to place a marker at the center of curvature for the middle strike index, this point was then used to plot points on the surface of the cylinder. These showed that the deformations are occuring as expected, and that any visual distortion is as a result of inconsistent scaling in each dimension.
A greatly exaggerated deformation to verify the deformation curvature. Curvature value calculationIn order to calculate the radius of curvature for each fault, the center strike transect was taken, and at each point along the transect the depth of the nearest (By surface distance) surface point is taken. For each triple of adjacent points with unique depth the distance between each pair of points is taken and the radius of the circle they define calculated. The mean of these radii was then taken for use. Testing demonstrated that the algorithm works for ideal data. The faults have the following curvatures calculated (km):
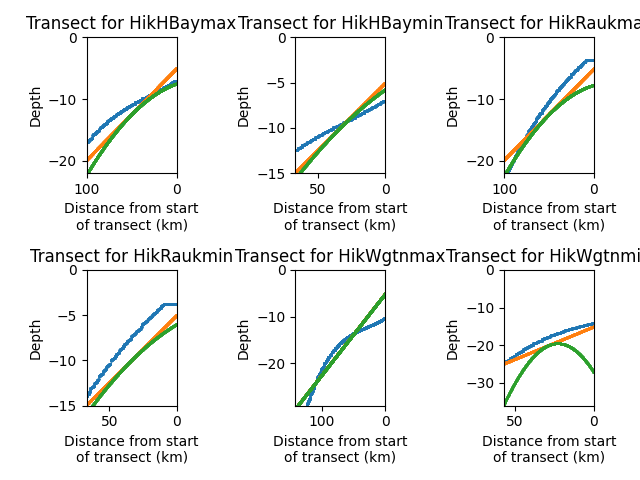
Current statusAs the HBay fault curvatures are clearly far too large (Resulting in small deformations) they were reduced by an order of magnitude. The current state of the deformations is visible below
The first four have worked relatively well. However Wgtnmax has not deformed at all, and Wgtnmin has deformed, much too far. The next step is to apply the appropriate dip to each fault and then a vertical shift to move them into alignment with the given surface. |

| Expand | |||||||||||||||||||||||||
|---|---|---|---|---|---|---|---|---|---|---|---|---|---|---|---|---|---|---|---|---|---|---|---|---|---|
| |||||||||||||||||||||||||
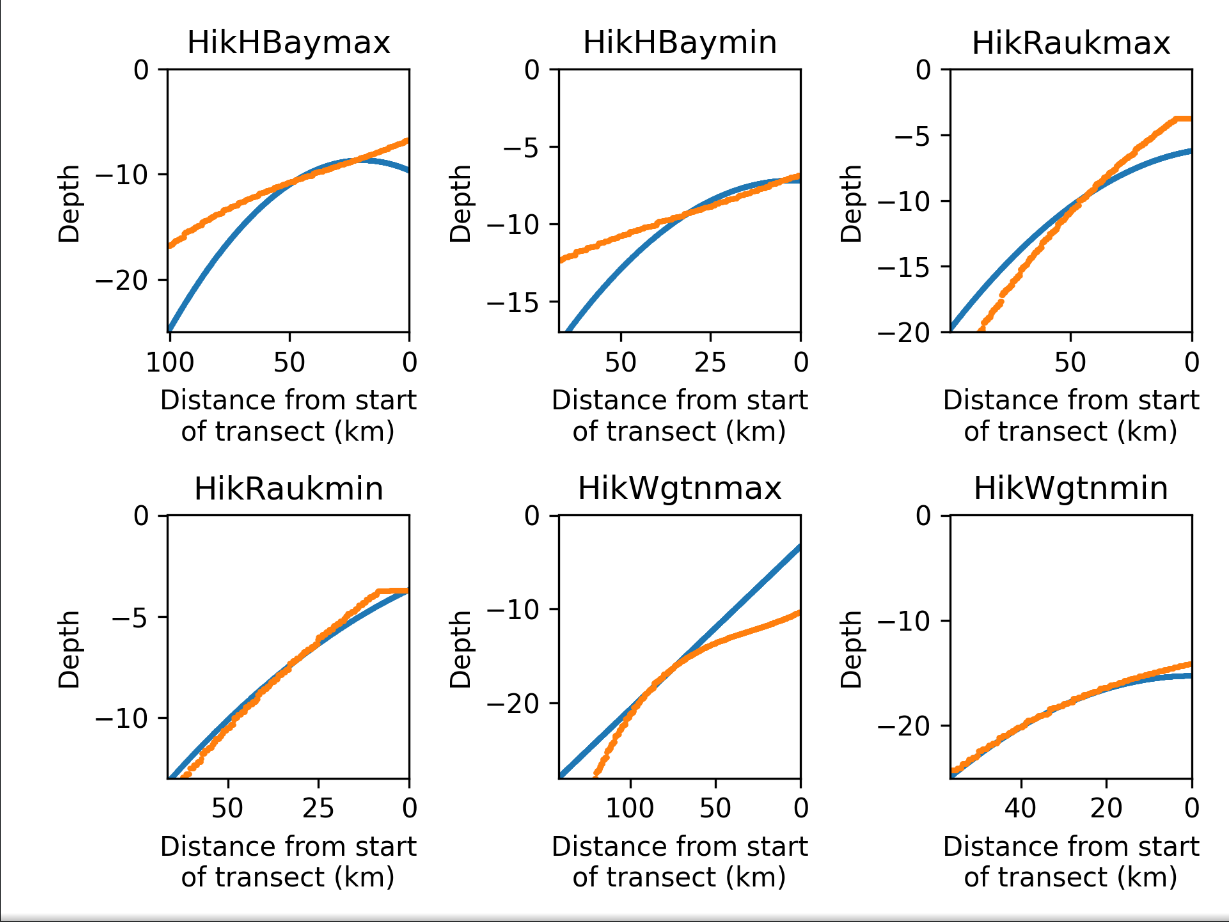
To increase the accuracy of the fault geometry the dip and depth of the fault should be changed to match that of the surface. The dip was calculated by taking the leftmost and rightmost depths (Ignoring duplicate points such as those visible at the top of HikRaukmin) and calculating the dip angle. The depth difference was calculated by taking the difference in depth at the center point.
After applying these values the following changes were achieved:
The surface is in orange, while the srfs are in blue. The bug resulting in Wgtnmax being translated/rotated but not curved has not yet been found. Performance improvements have been made to allow for more rapid testing/debugging |
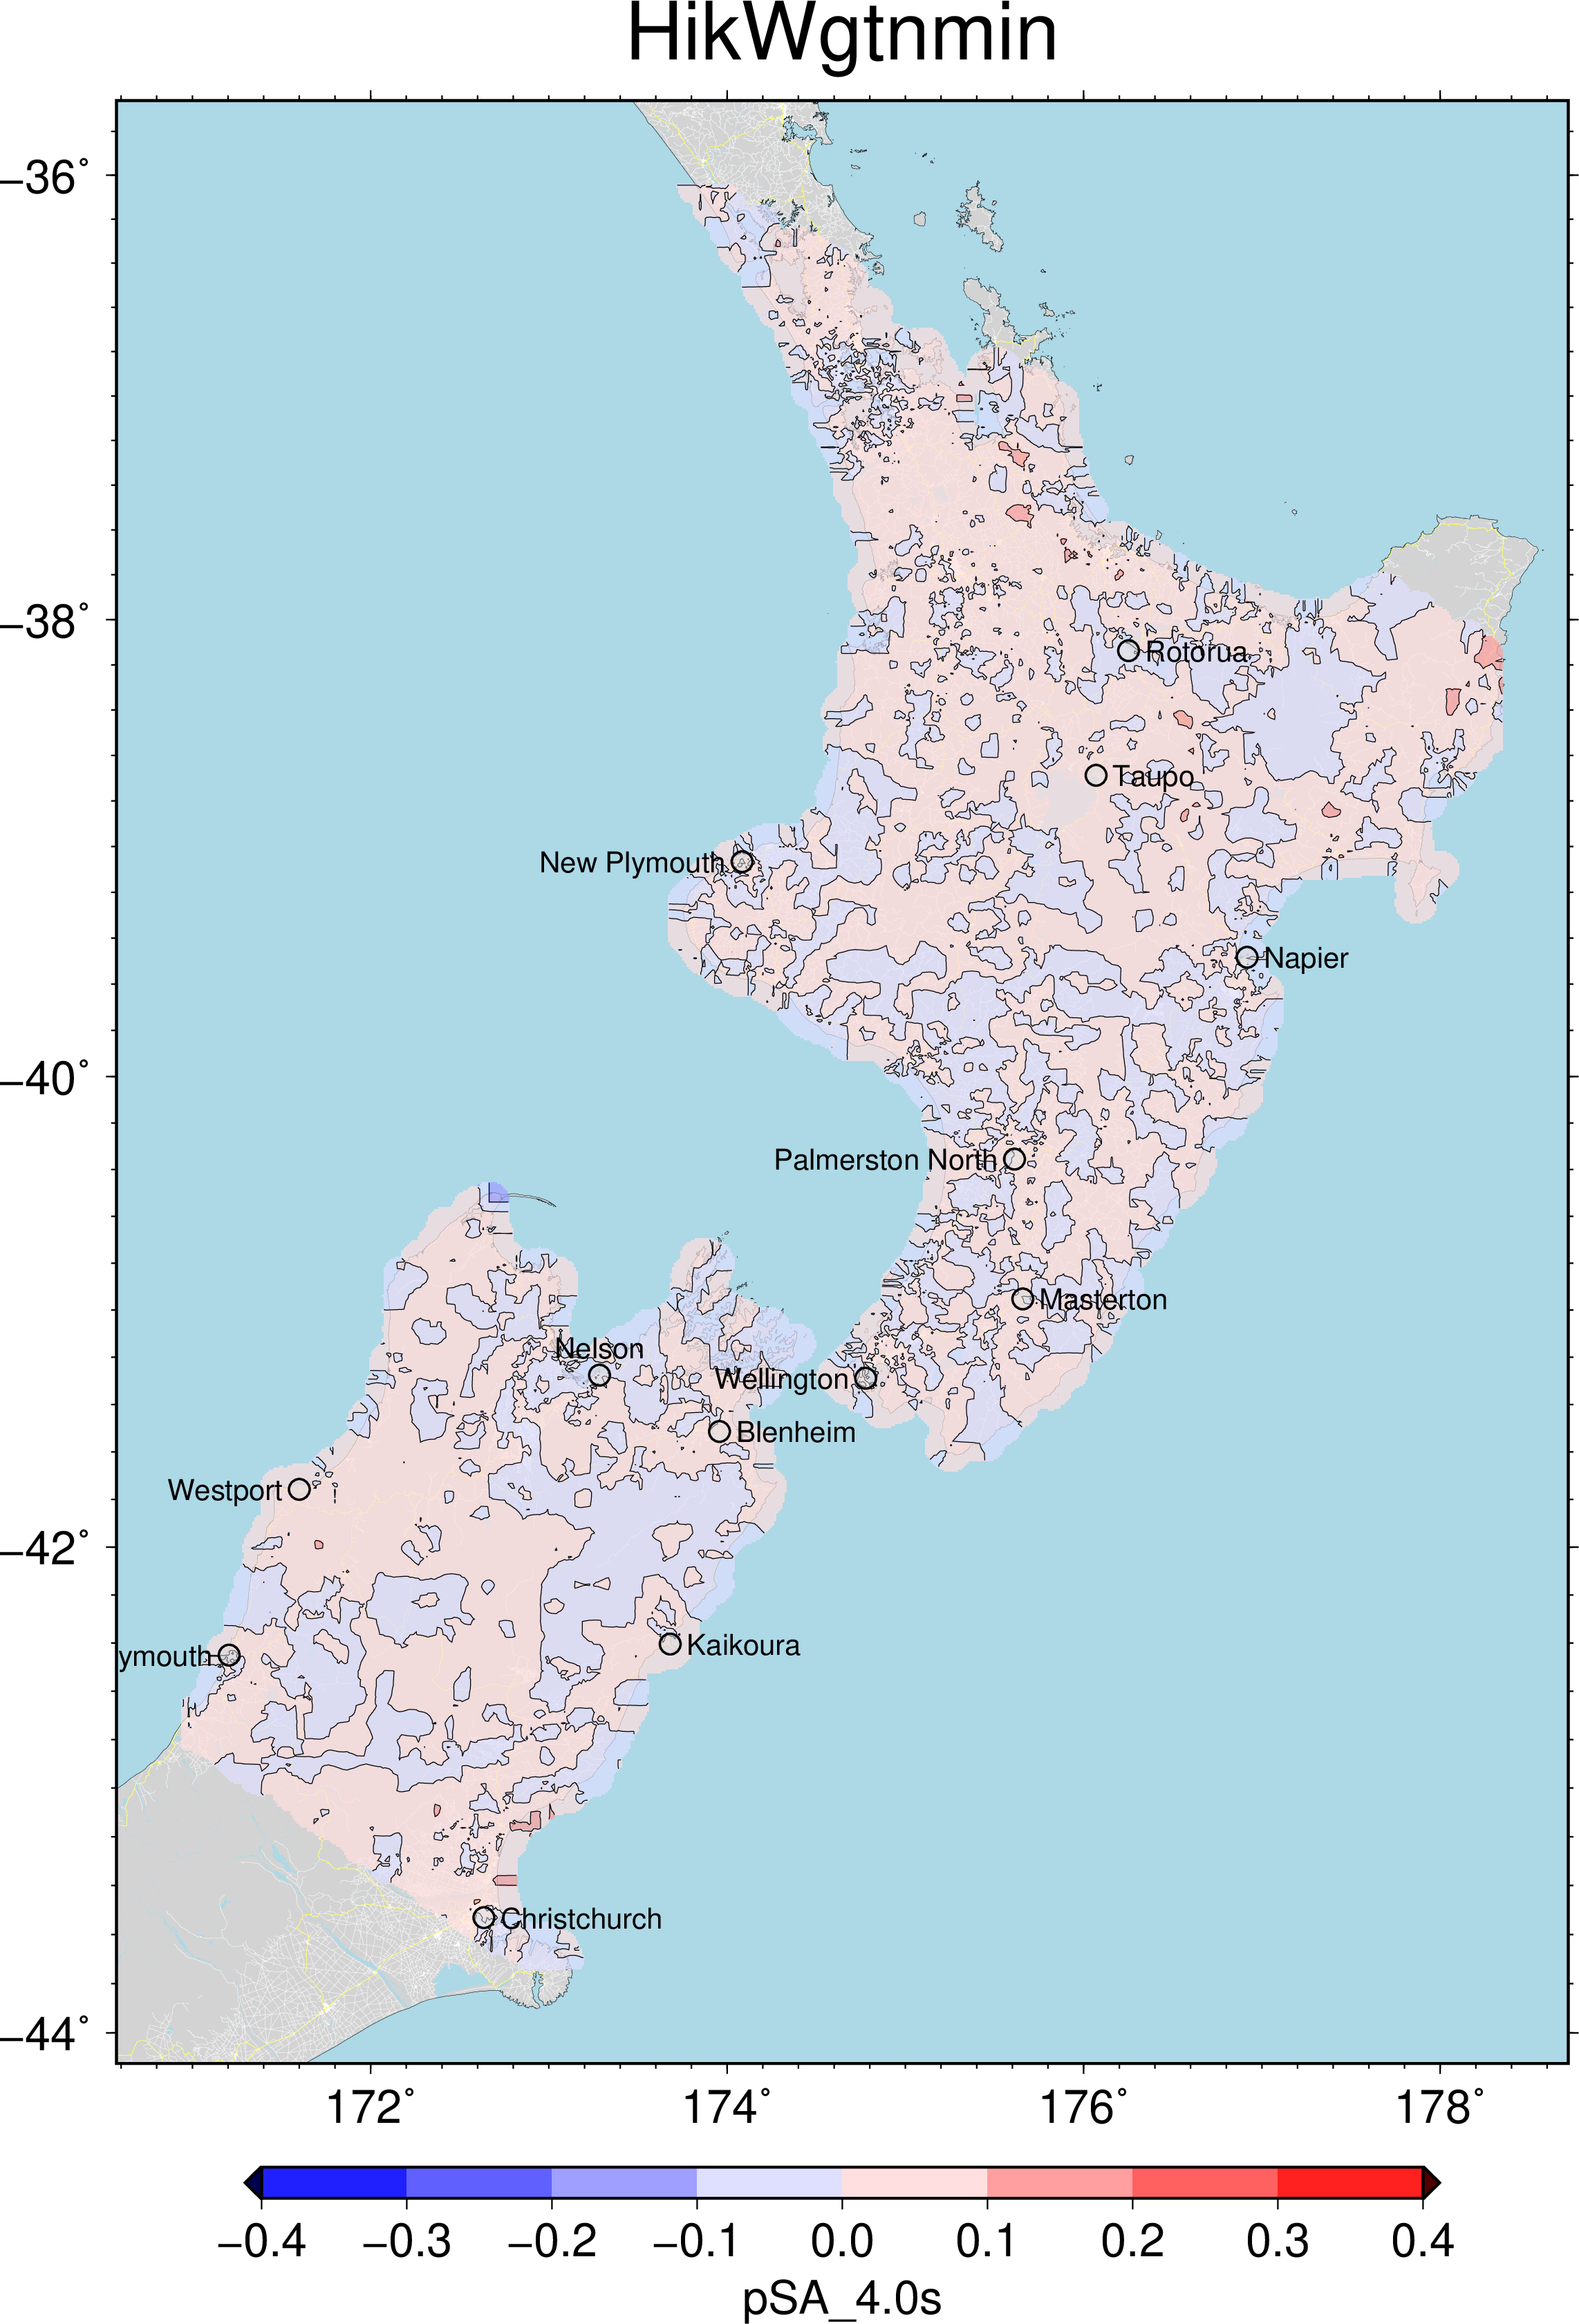
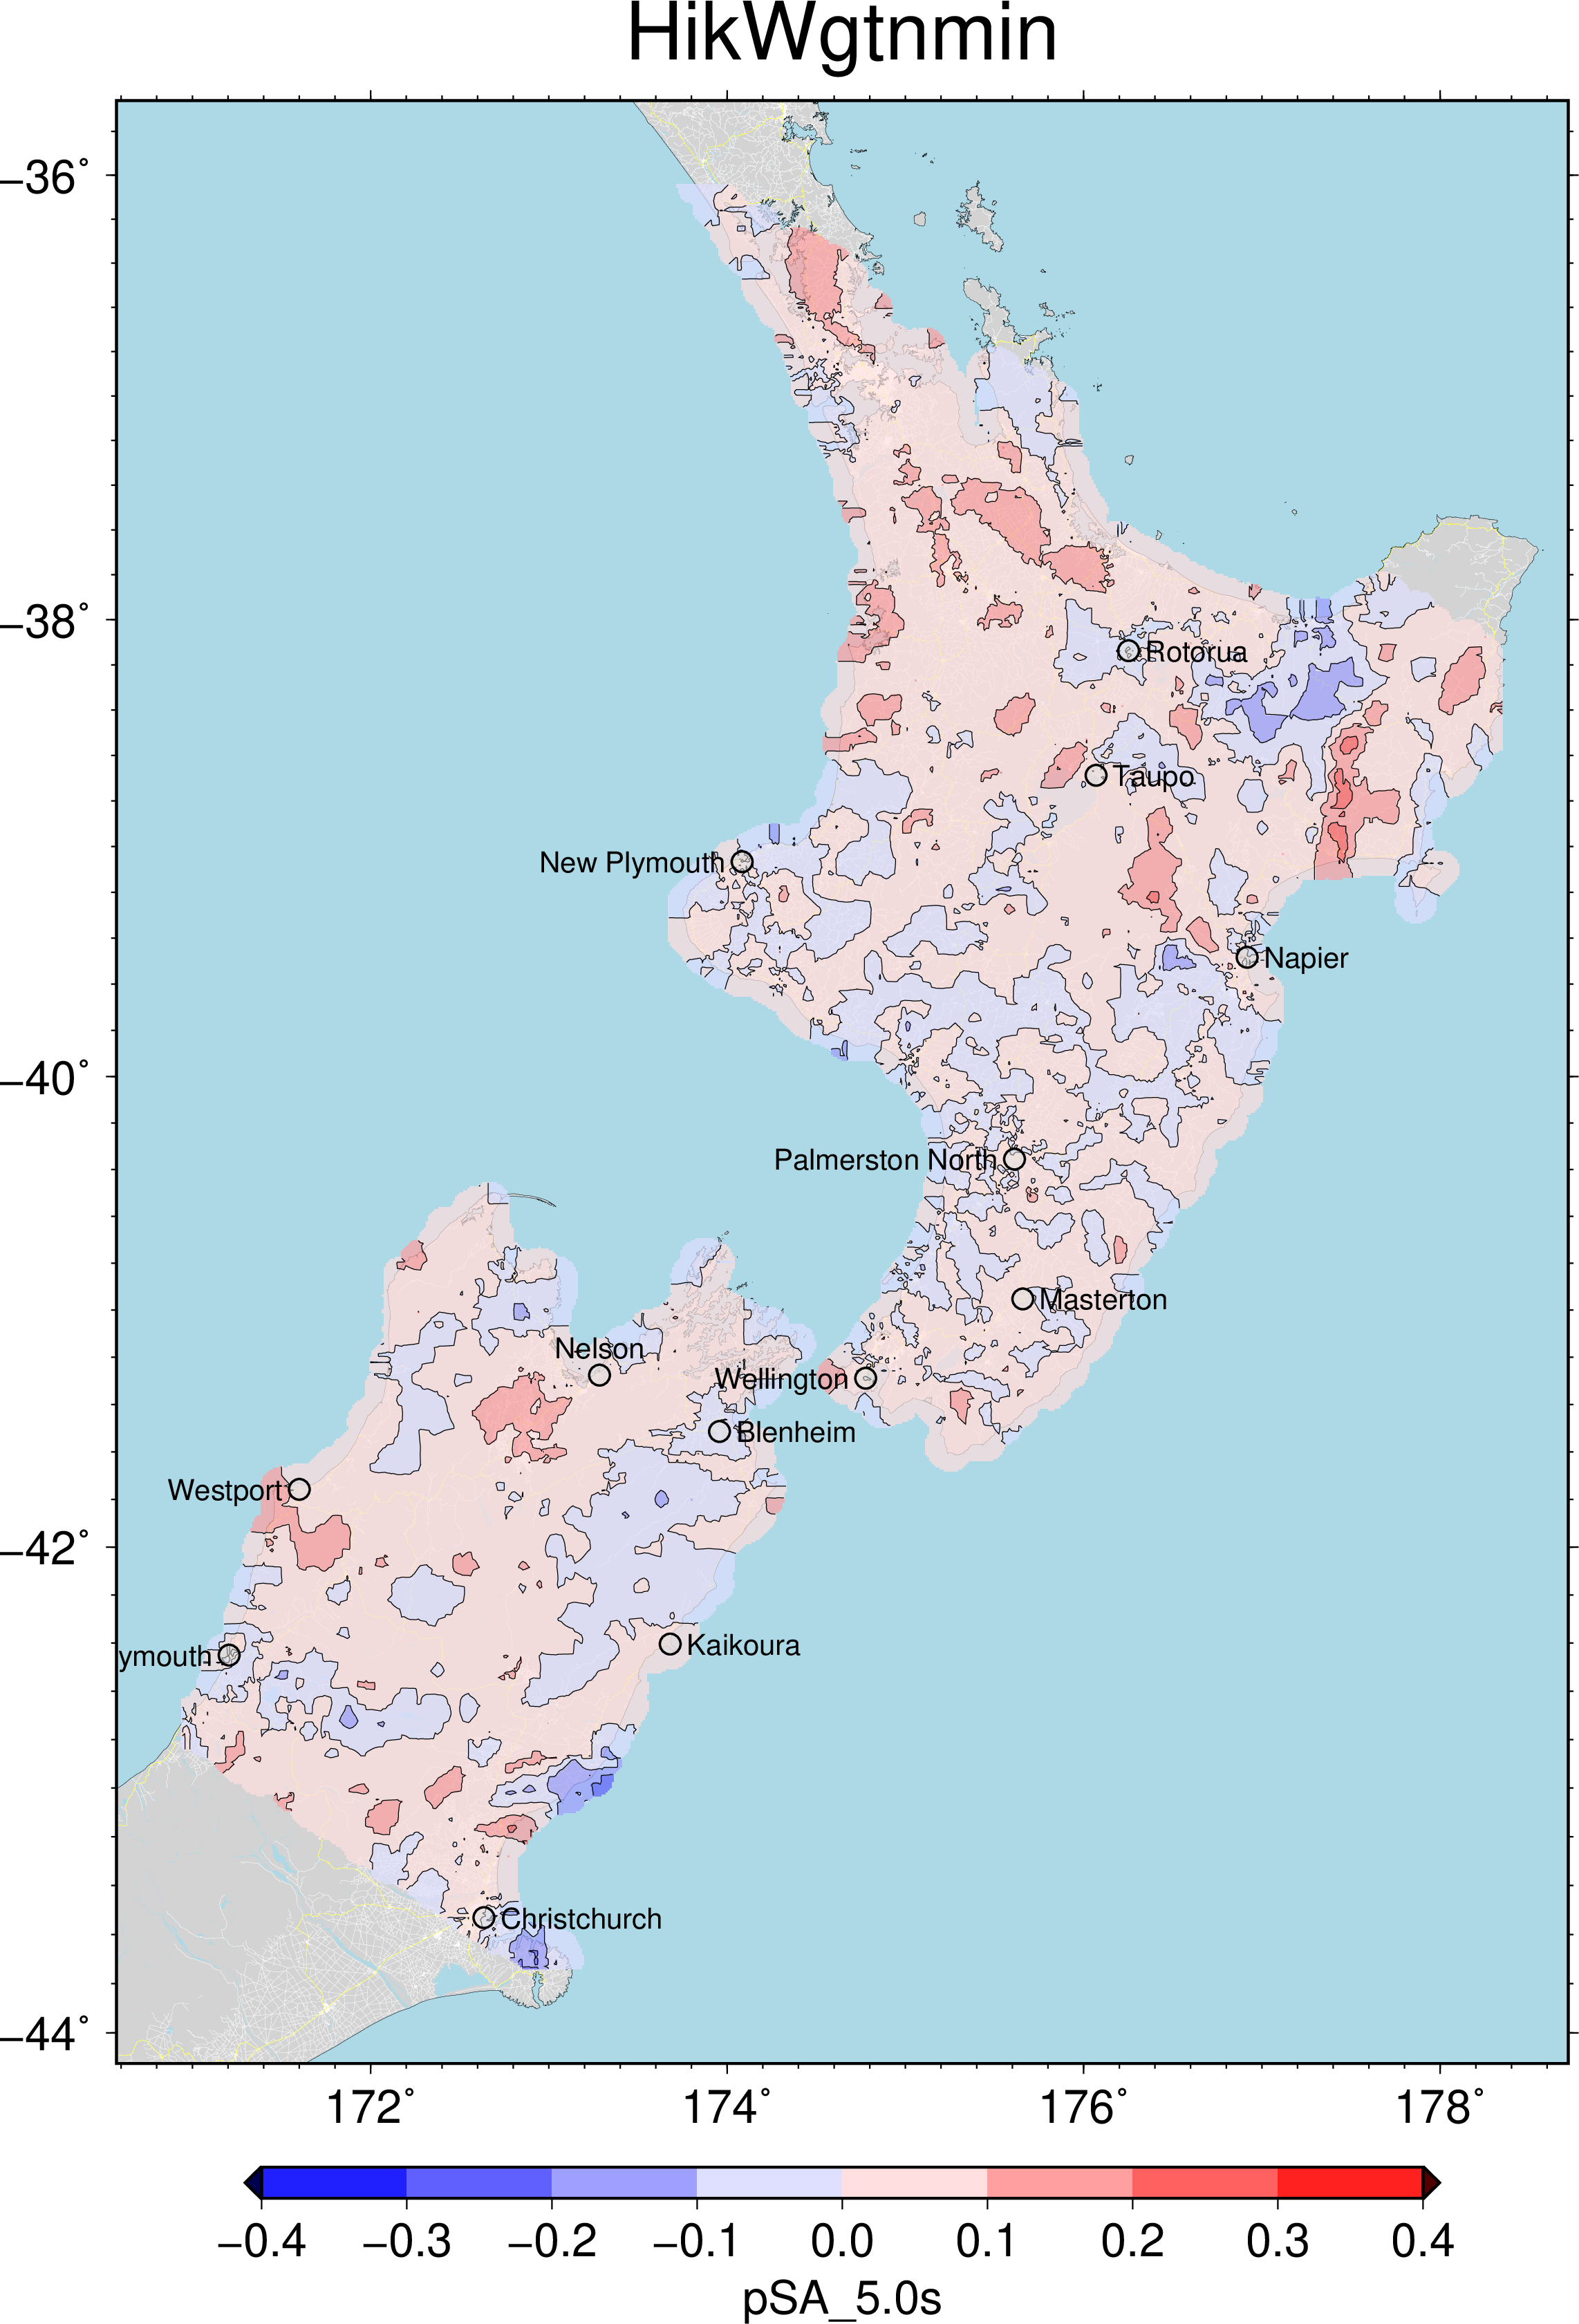
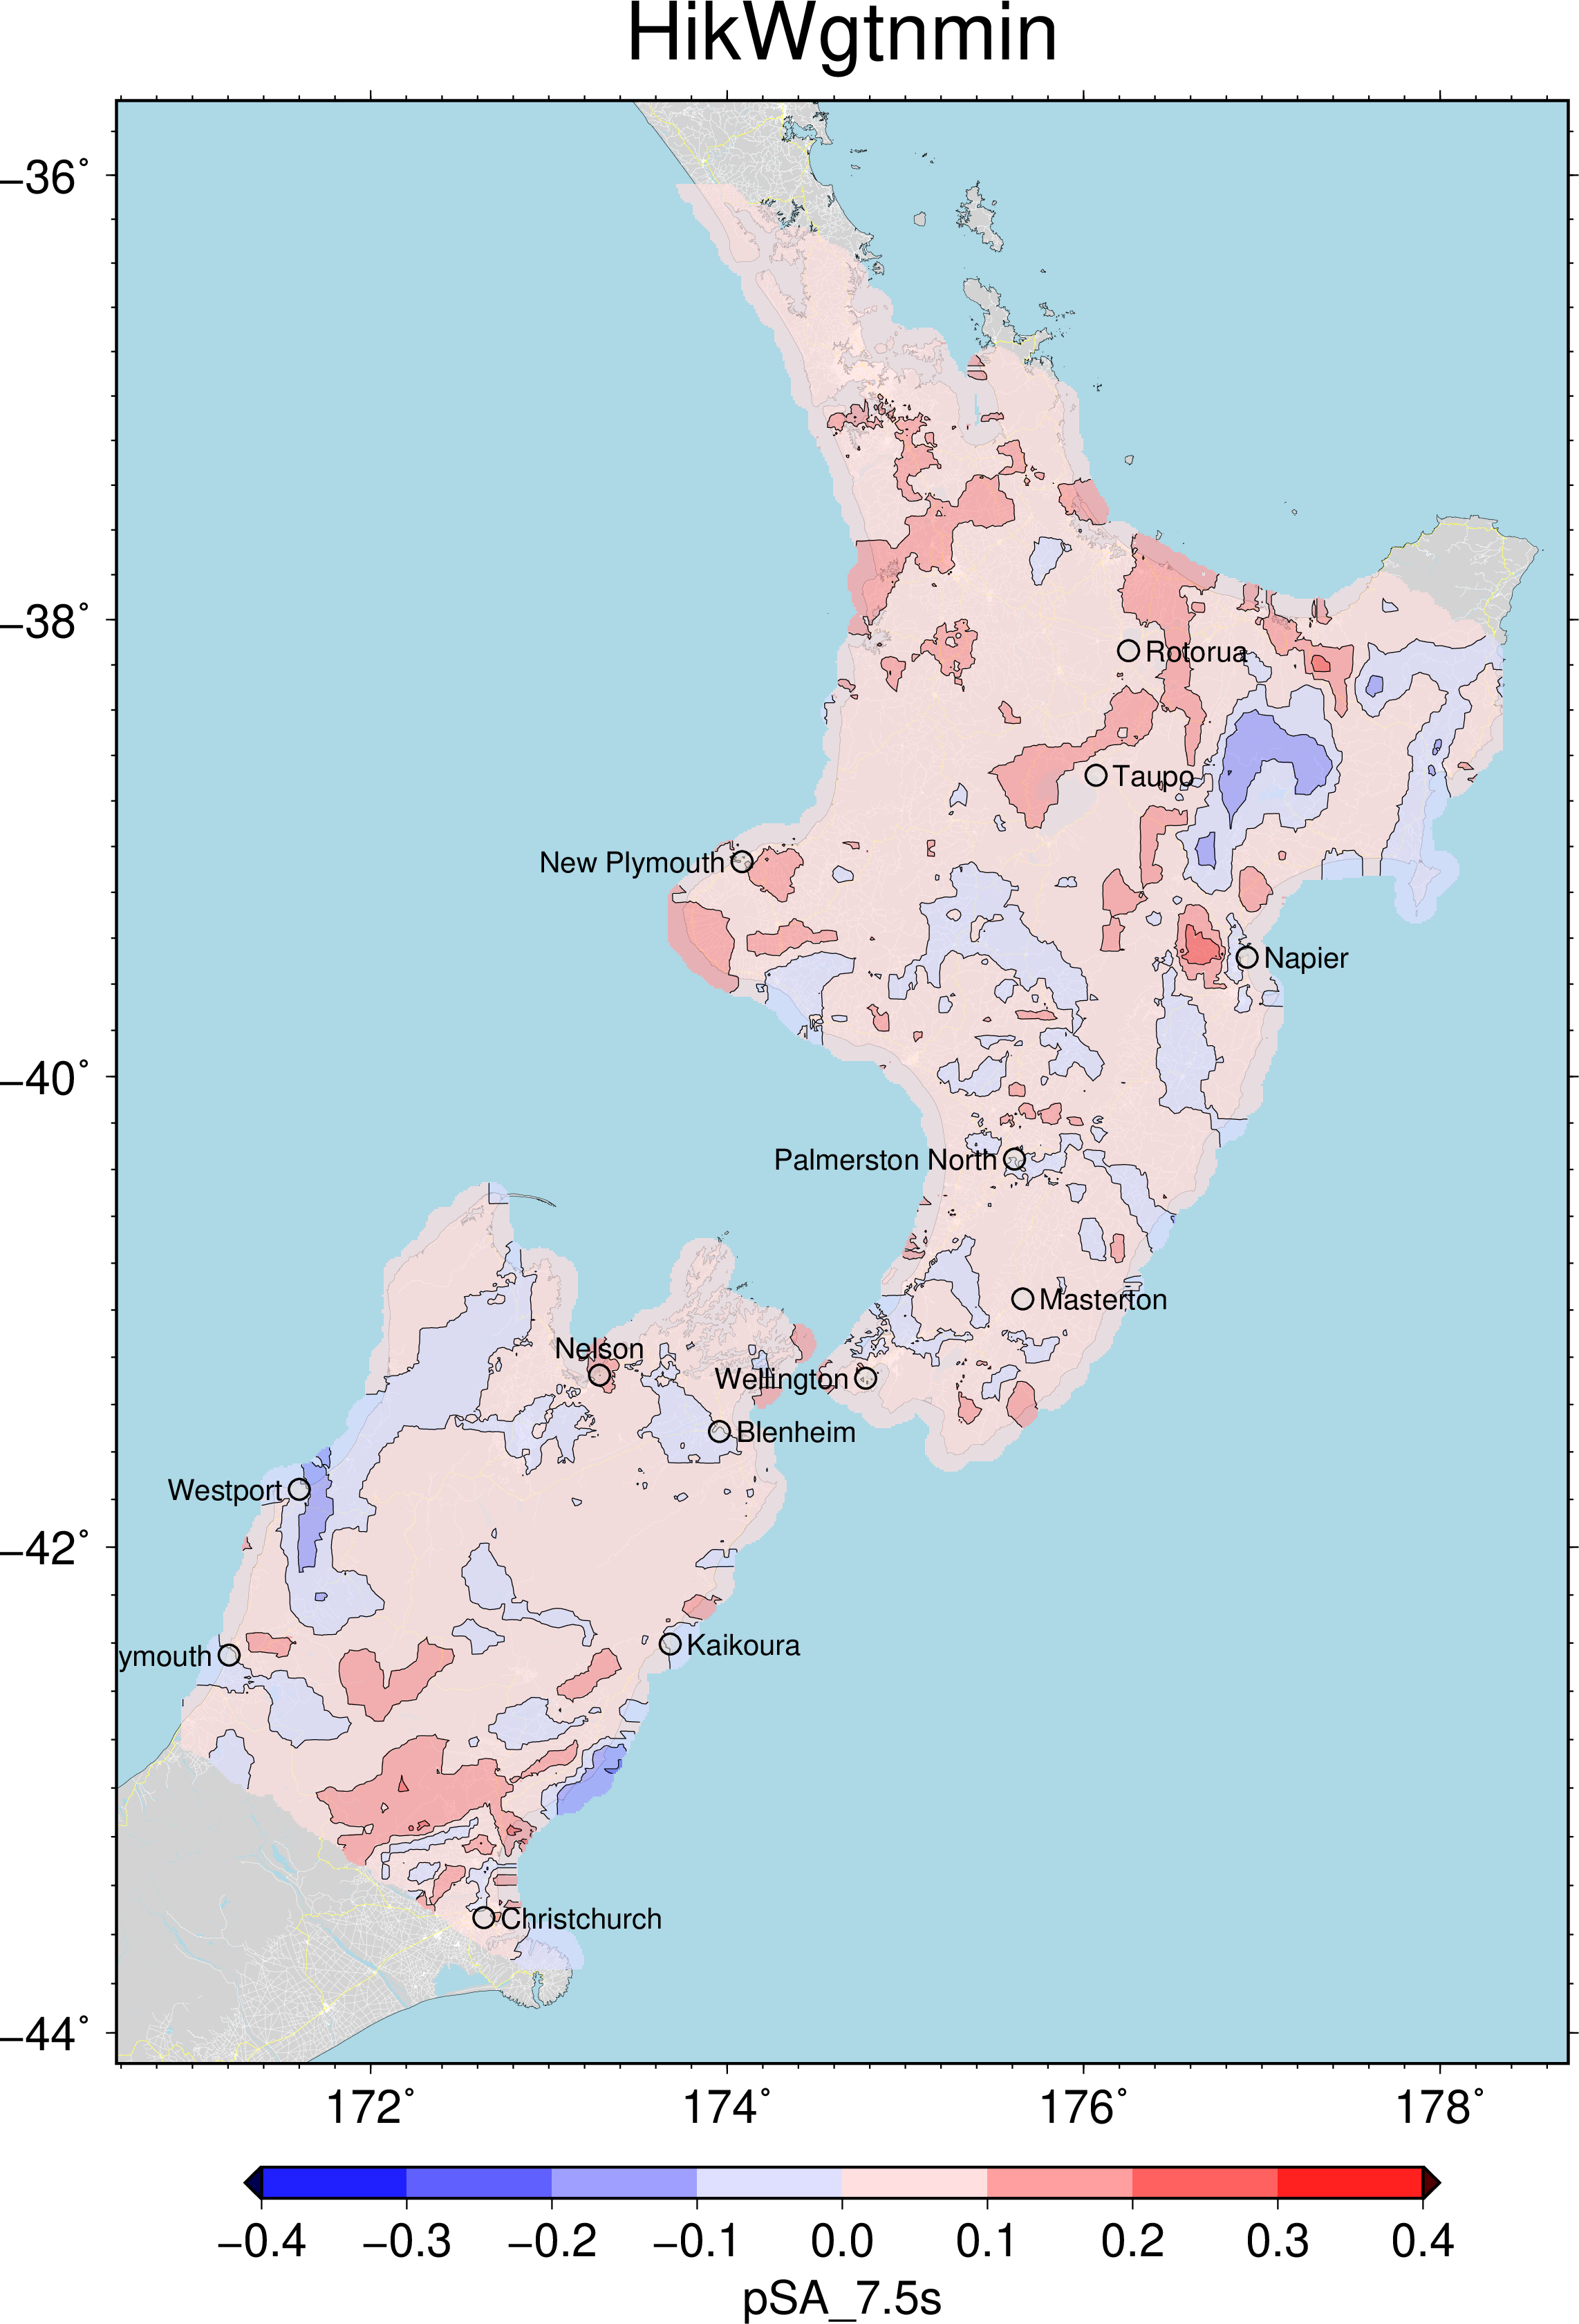
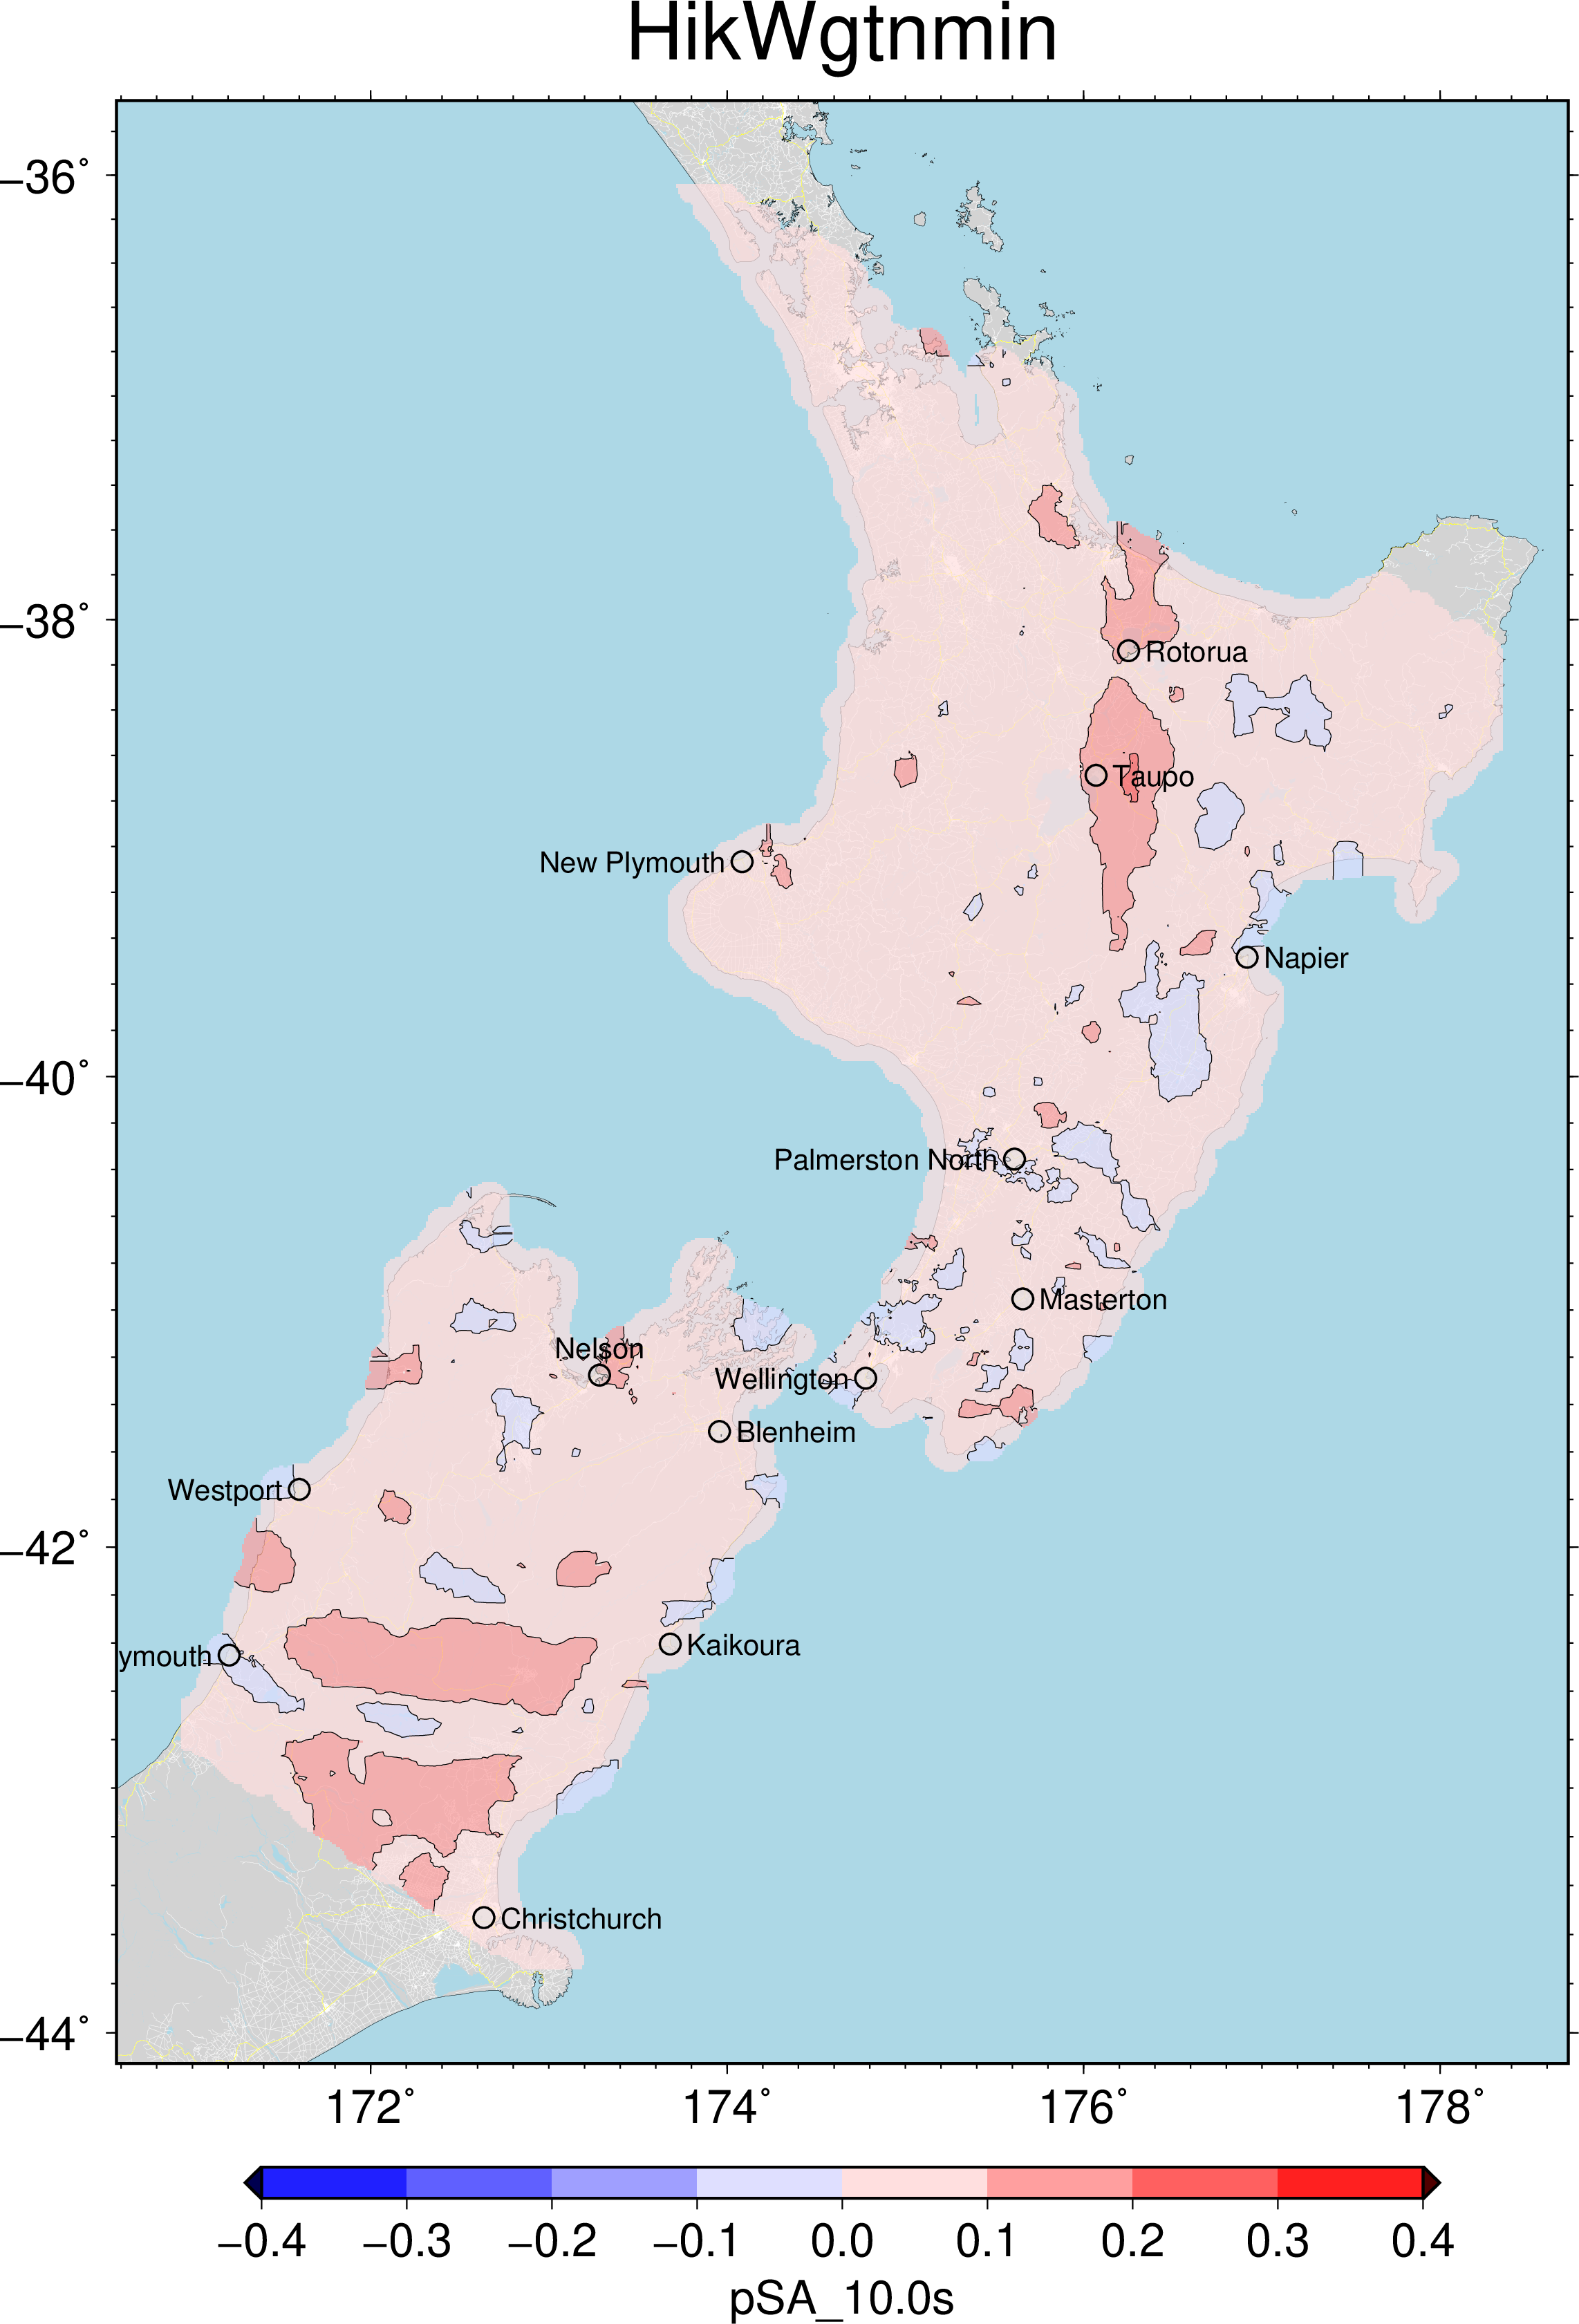
An initial pilot simulation has been done using one realisation of HikWgtnmin.
A realisation of HikWgtnmin was generated and the srf had curvature applied.
As the stock files are not yet able to have curvature applied the same HF was used for both runs.
LF was run for each srf and the relevant BBs created. Intensity measures were calculated from the BB waveforms and IM log ratio maps plotted.
For pSA<4 (The HF/LF transition frequency) the differences were minimal. The plots for pSA>=4.0 are available below: