This is a space for you to shove comments on figures as per requests
Figure 1 - Liquefaction
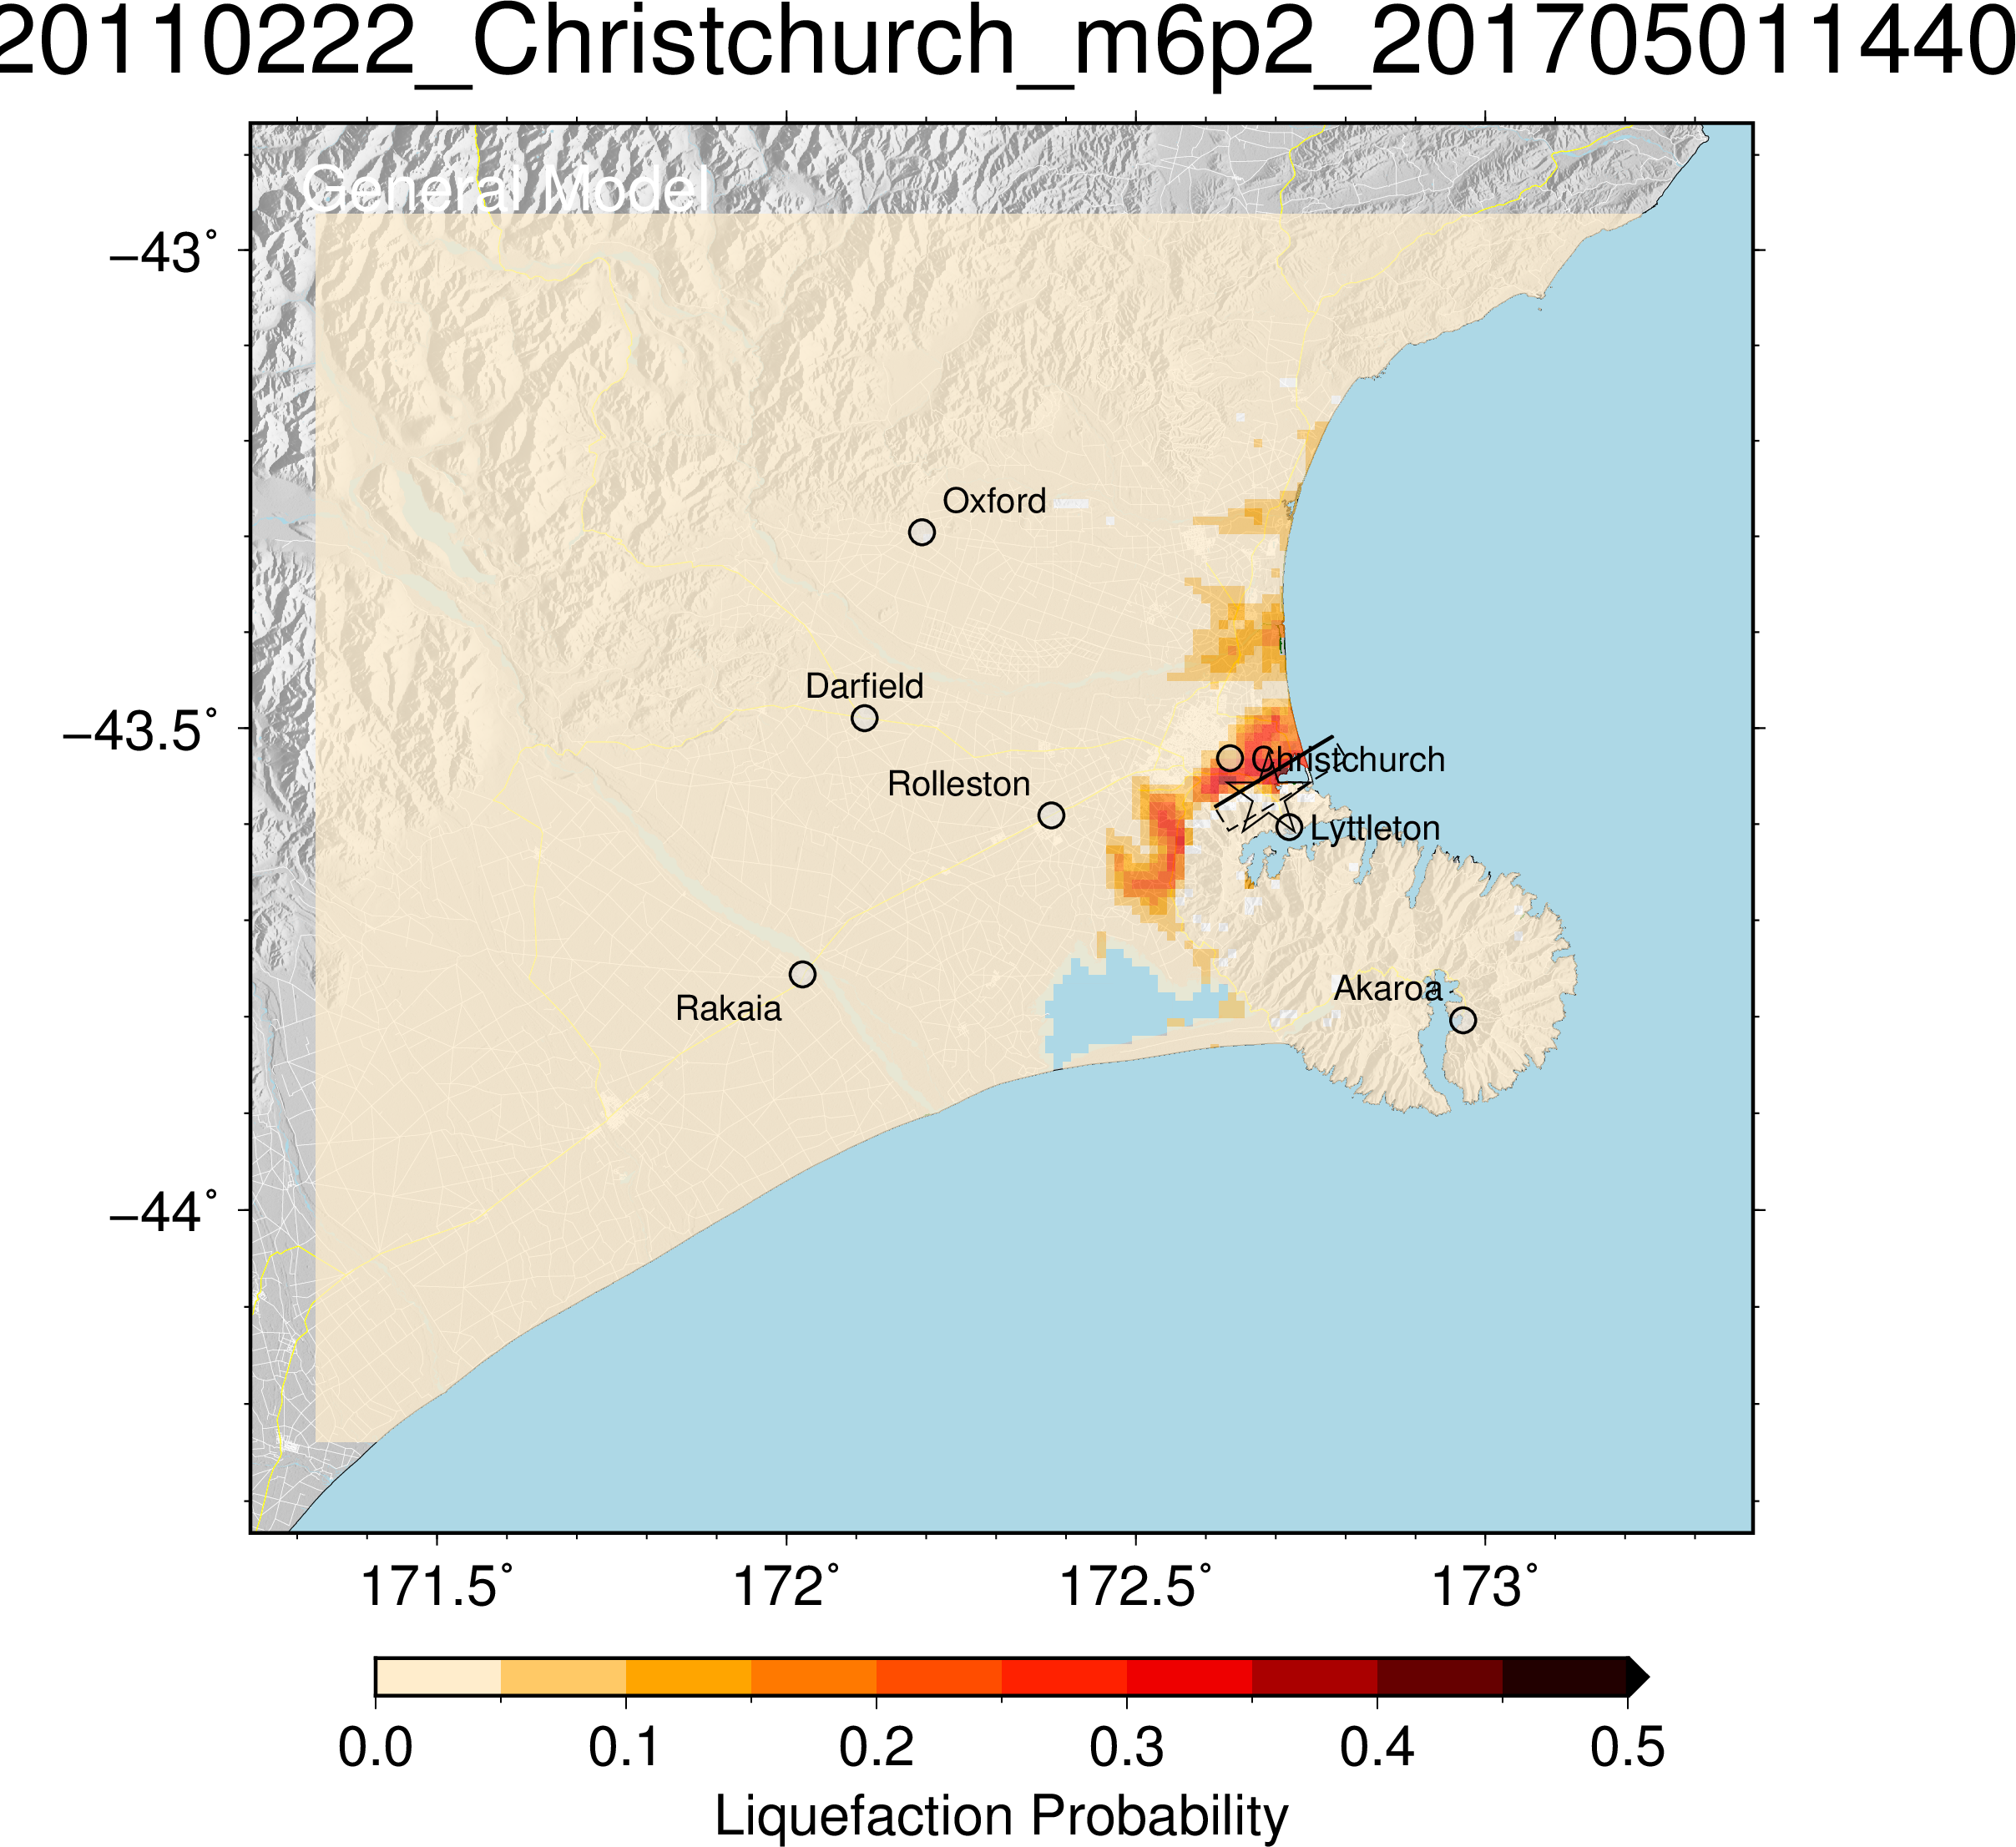
- The star indicates the earthquake location but it's a little clippy on the box
- The box indicates fault plane which doesn't seem particularly useful to the public; perhaps a fault line could be useful but the idea of the slip plane is very hard to get from a 2D picture
- Probability goes from 0 to 0.5, which is strange; we had liquefaction so surely that should be probability 1?
- No mention of probability, only severity
Figure 2 - Landslides
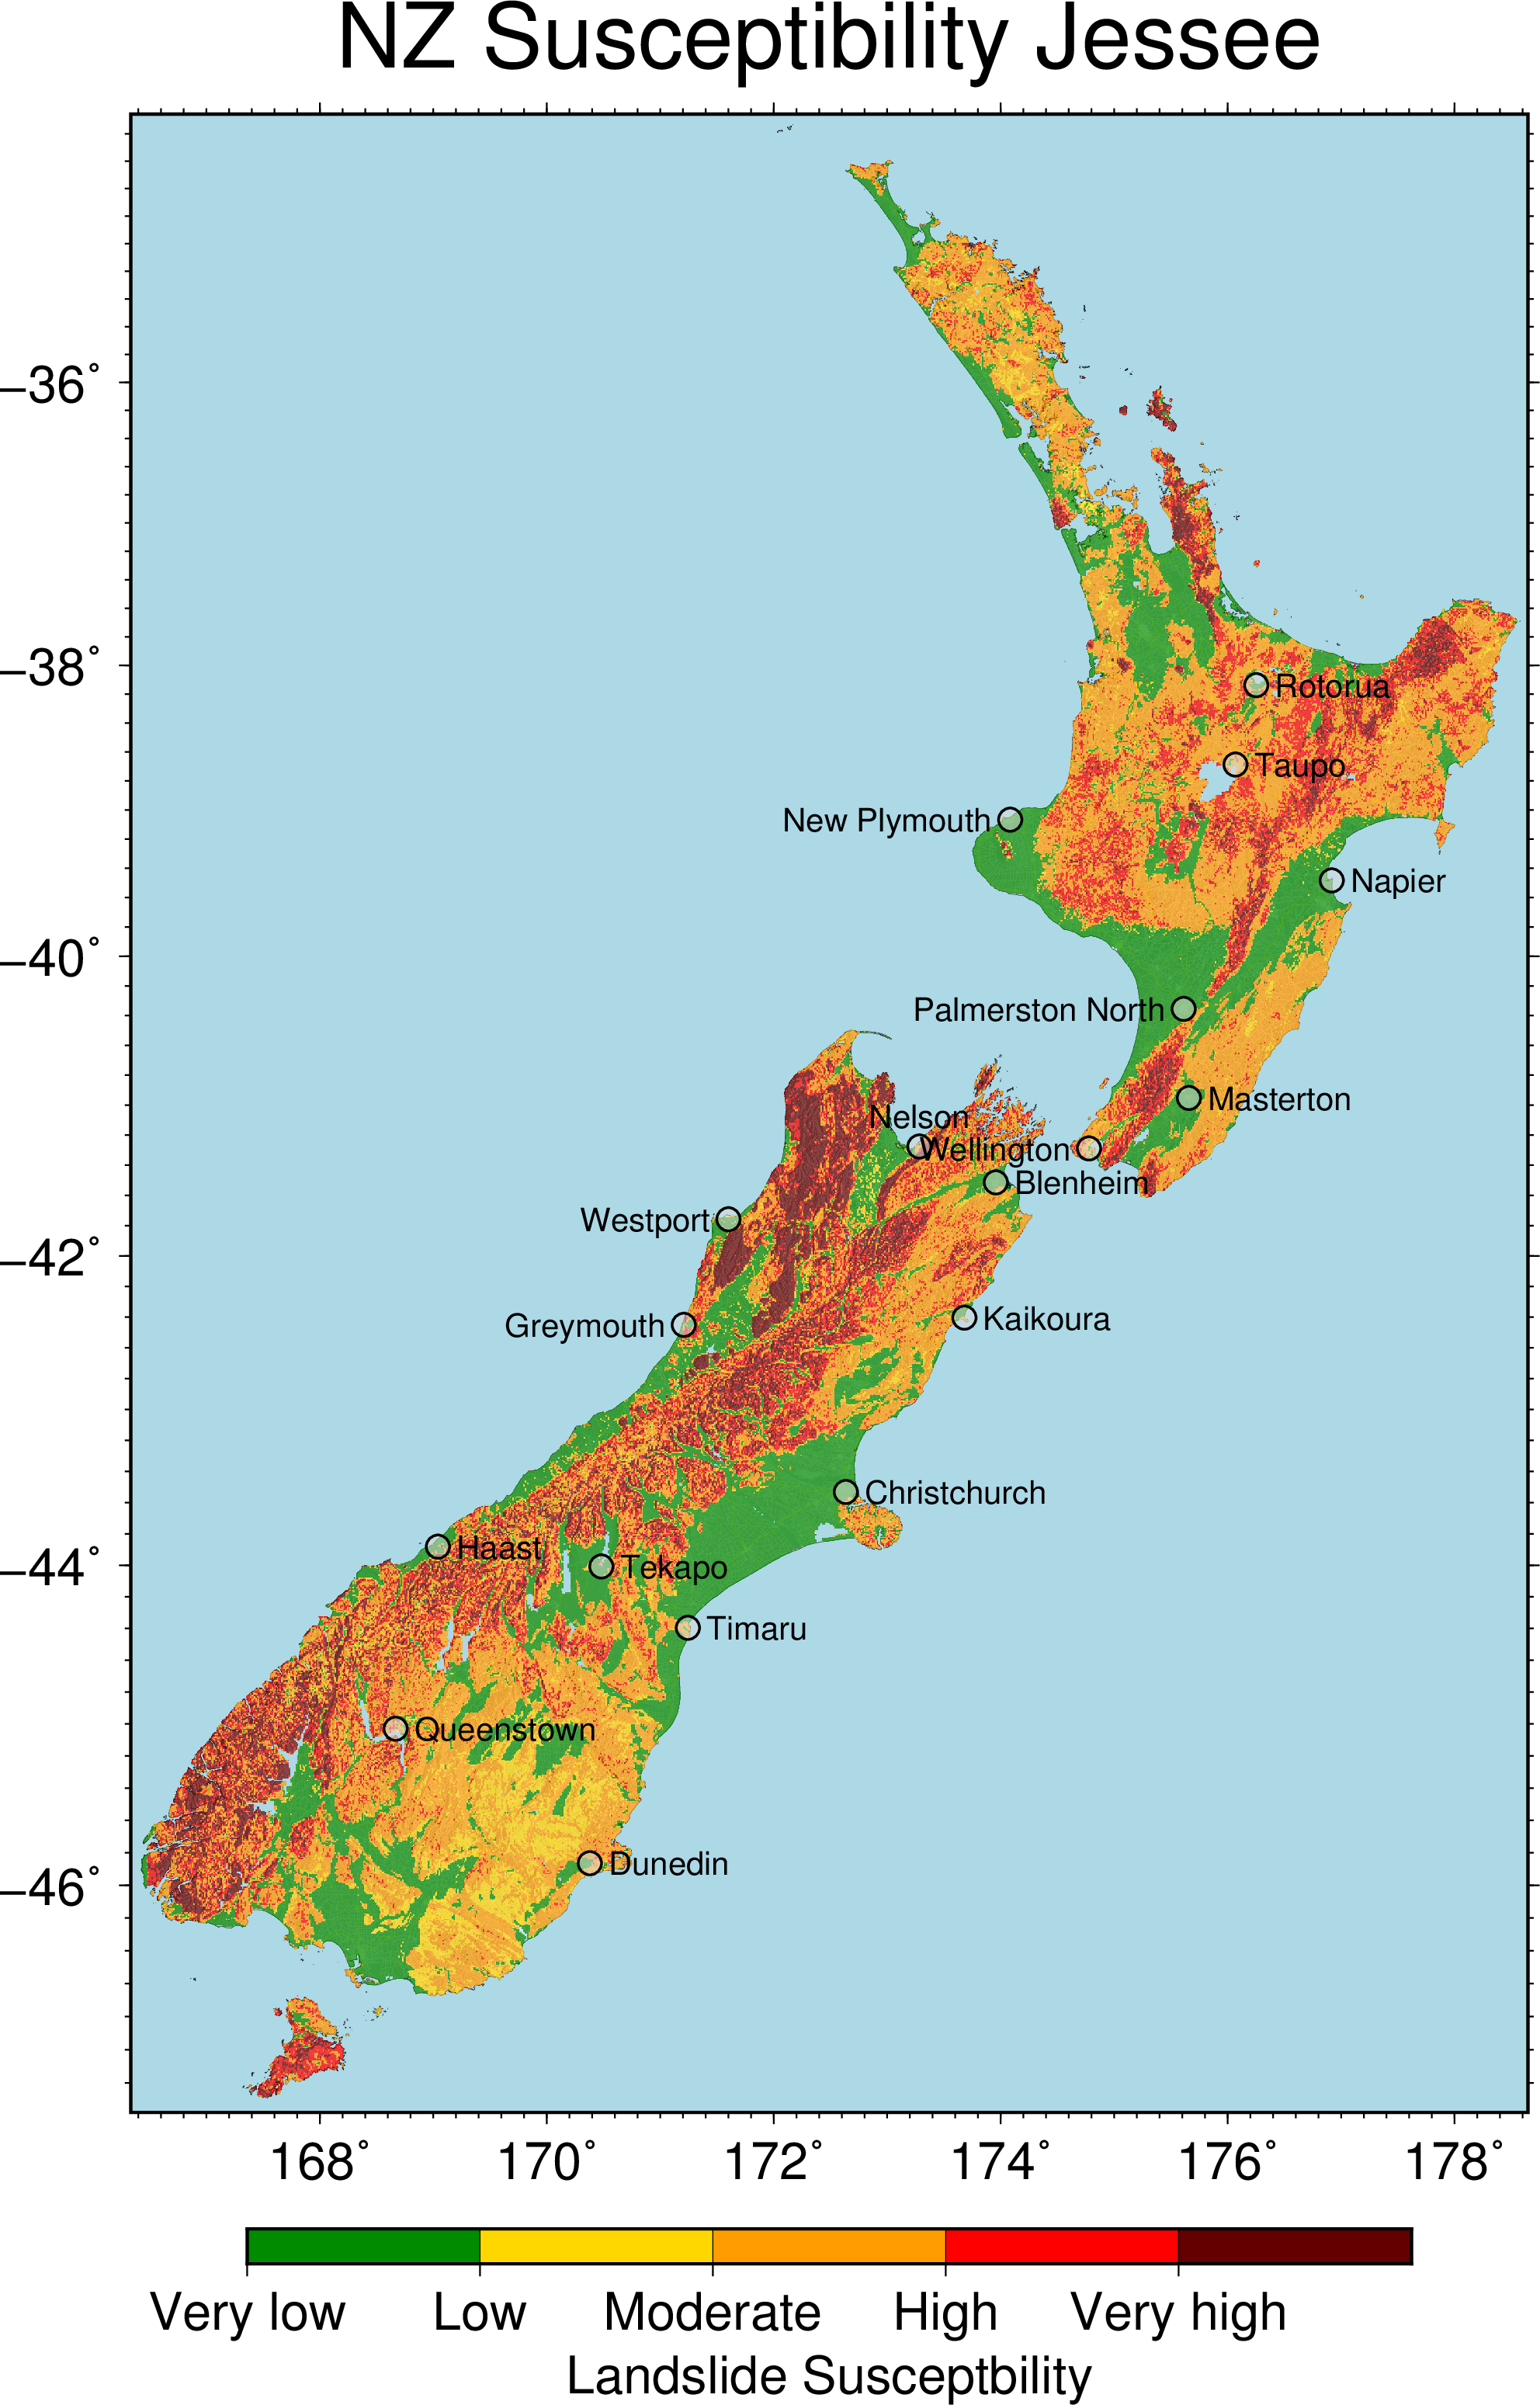
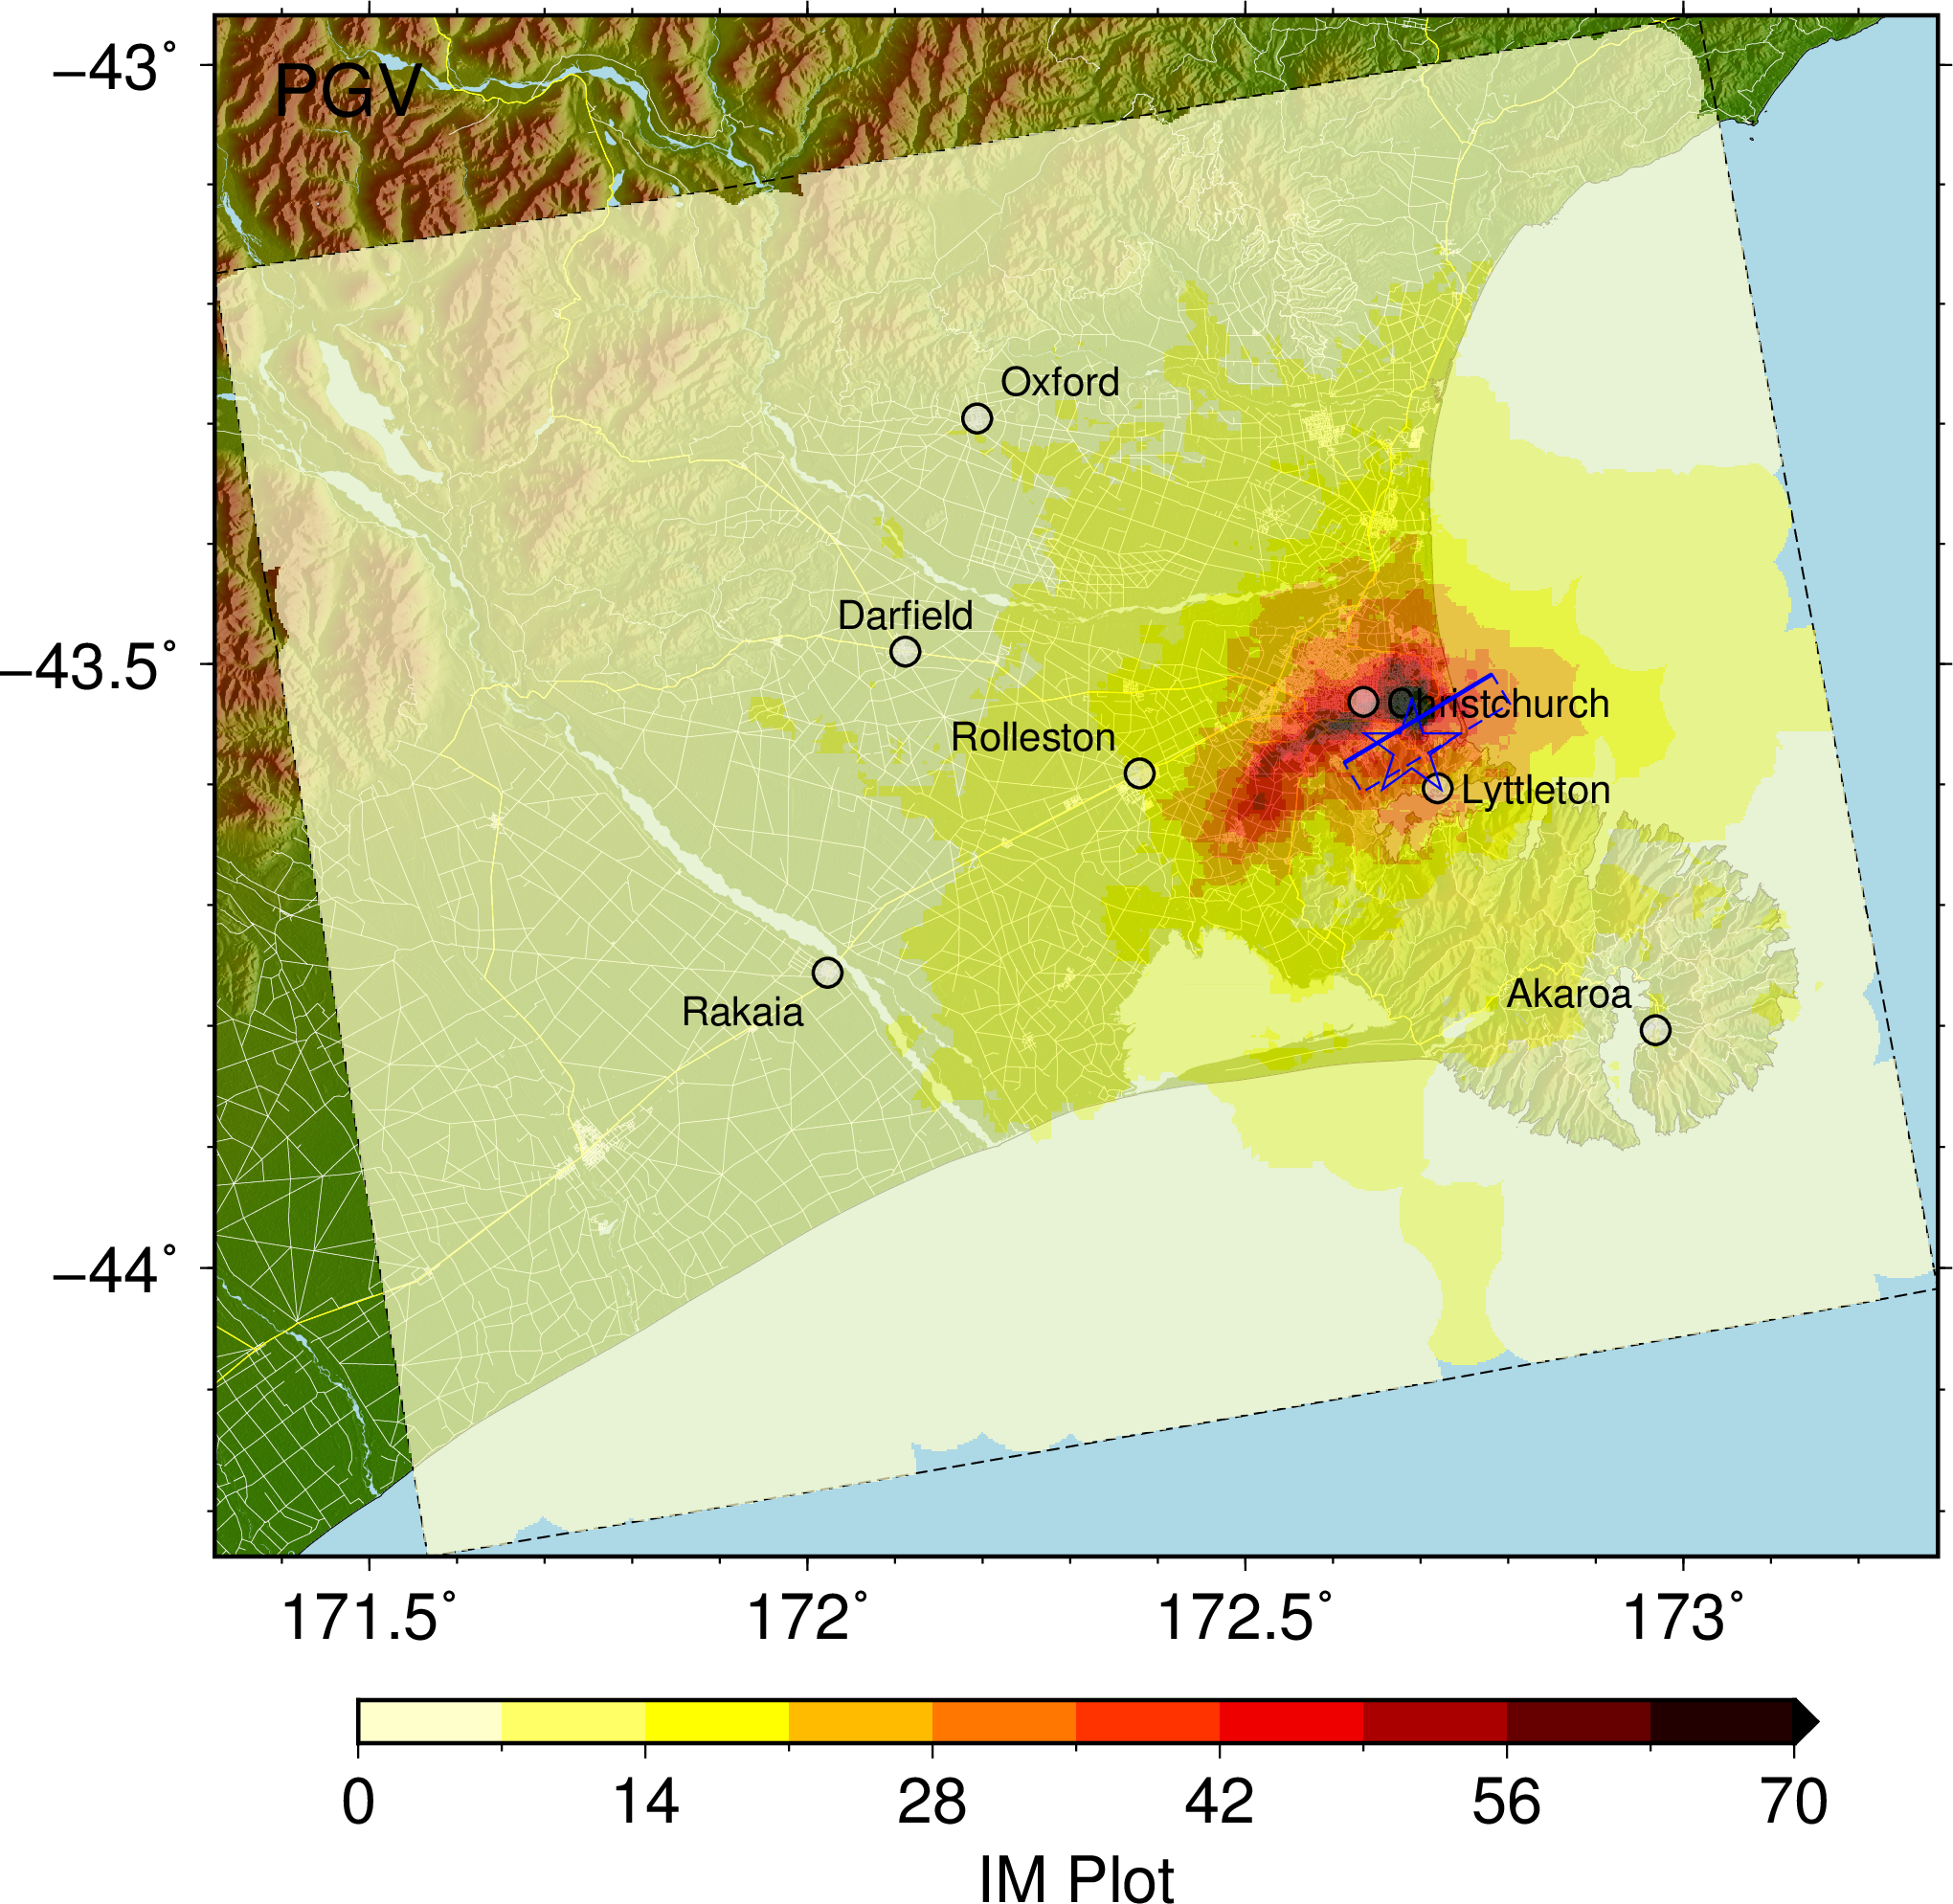
Figure 3 - What even is this
Video comments