...
| Expand | |||||||||||||||||||||||||||
|---|---|---|---|---|---|---|---|---|---|---|---|---|---|---|---|---|---|---|---|---|---|---|---|---|---|---|---|
| |||||||||||||||||||||||||||
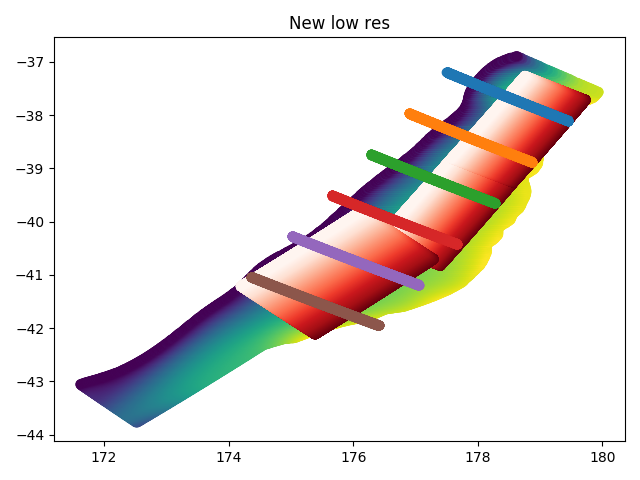
Comparison of modelsIn order to reduce the complexity of comparing the models, multiple transects along the fault will be taken where the NSHM faults, 2013 model and updated model will be compared. As the NSHM models do not go below 30 km, we restrict the view of the models from Williams to 40km depth The faults and models were plotted on scatter plots, the NSHM faults are visible in the red to white fade, with red representing the part of the fault near the surface (~5km), and the white representing the lower bounds of the fault plane (~30km). The fault surfaces from Williams are coloured from yellow (~2.4km) to dark blue (-40km). The full surface goes down to ~365km. The transects are also plotted here. The transects are spaced 100km apart, with a length of 200km, going from South East to North West. The end points form a line with a strike of 120 degrees, and the transects have a strike of 210 degrees.
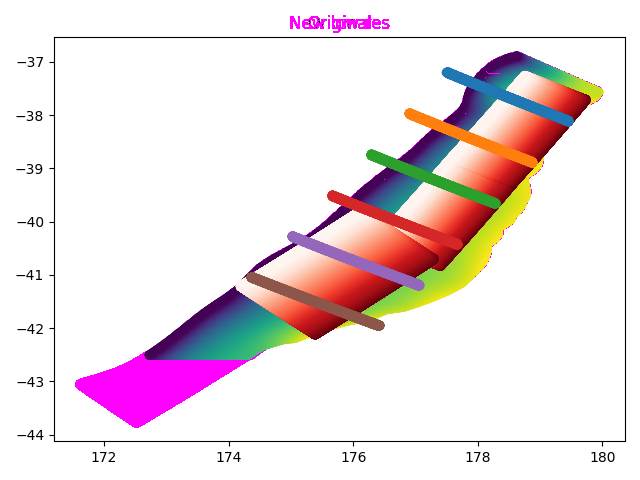
Both surfaces from Williams seem extremely similar with the exception of the region South of -42.5 degree latitude. A basic image comparison is available below, the differences are in pink, while the similarities are shown in true colour.
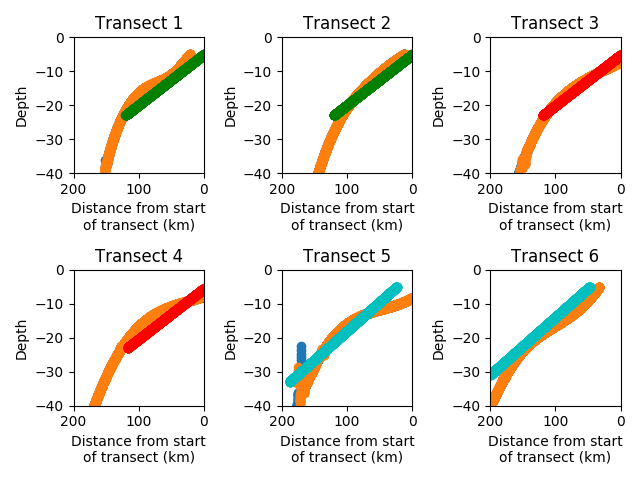
With the exception of the Southern region the surfaces are extremely similar TransectsTo generate the transect views interpolators were used to generate the depth of the interface models along the transects, with the NSHM fault planes also shown:
As can be seen there is some artifacting and large difference between surfaces from the interpolator in transect 5. Using a basic metric of the difference in vertical distance the two surfaces were found to have differences as shown:
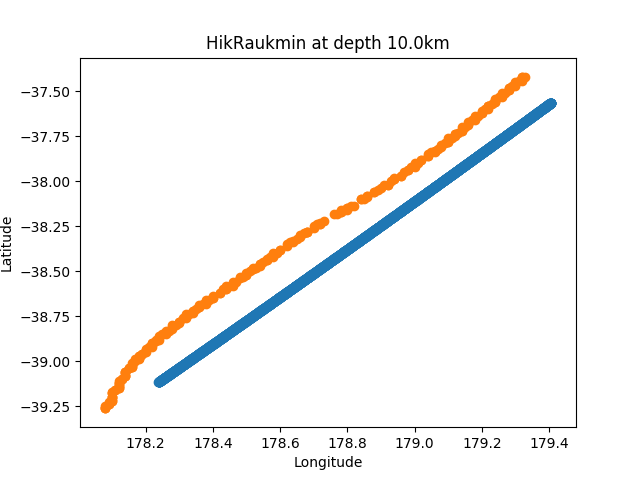
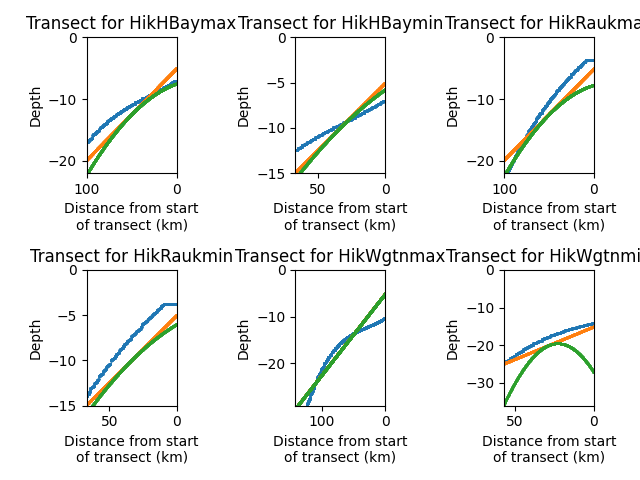
With the exception of transect 5, the differences are relatively small. Initial applicationThe initial plan for applying the plane to the curve is to take the average curvature horizontally at the middle depth, and vertically along the middle strike, and apply these uniformly to the fault plane created from the NSHM. Each of the NSHM faults were plotted at the depth half way down dip. The updated surface from Charles was plotted at the same depth. Points with a depth within 20m of the target depth were plotted.
Most of the NSHM plots are quite close to the surface plots, with the exception of HikRaukmax, where the surface has a noticeably large curvature in the middle of the NSHM region. First implementationThe first implementation is to apply a constant curvature to the dip. T To do this each of the points in the fault must be moved such that they lie on the surface of a cylinder with a given radius (Our measure of curvature). To ensure that the calculations are correct the distance between subfaults must be the same before and after the curvature is applied. Using some reference dip row, chosen as the center row for now, as the stationary row, the other rows are moved back and towards the center some amount. For test purposes the fault Hossack was used. A curvature of 58km was selected, as this would result in a shift of approximately 500m for the end rows of a Hikurangi min scenario, which would be used as the first Hikurangi test case.
The current state of the curvature script is visible above. The bottom points seem to have moved in the right direction, and computations show that all rows are ~100m from the adjacent row, as they were before the shift. The top points however seem to be moved too far up and right, as all the points should be moved back from the plane in a direction normal to the plane, and then translated towards the center of the plane where the reference row is. |


| Expand | ||||||||||||
|---|---|---|---|---|---|---|---|---|---|---|---|---|
| ||||||||||||
Verification of deformationUsing a function to place a marker at the center of curvature for the middle strike index, this point was then used to plot points on the surface of the cylinder. These showed that the deformations are occuring as expected, and that any visual distortion is as a result of inconsistent scaling in each dimension.
A greatly exaggerated deformation to verify the deformation curvature. Curvature value calculationIn order to calculate the radius of curvature for each fault, the center strike transect was taken, and at each point along the transect the depth of the nearest (By surface distance) surface point is taken. For each triple of adjacent points with unique depth the distance between each pair of points is taken and the radius of the circle they define calculated. The mean of these radii was then taken for use. Testing demonstrated that the algorithm works for ideal data. The faults have the following curvatures calculated (km):
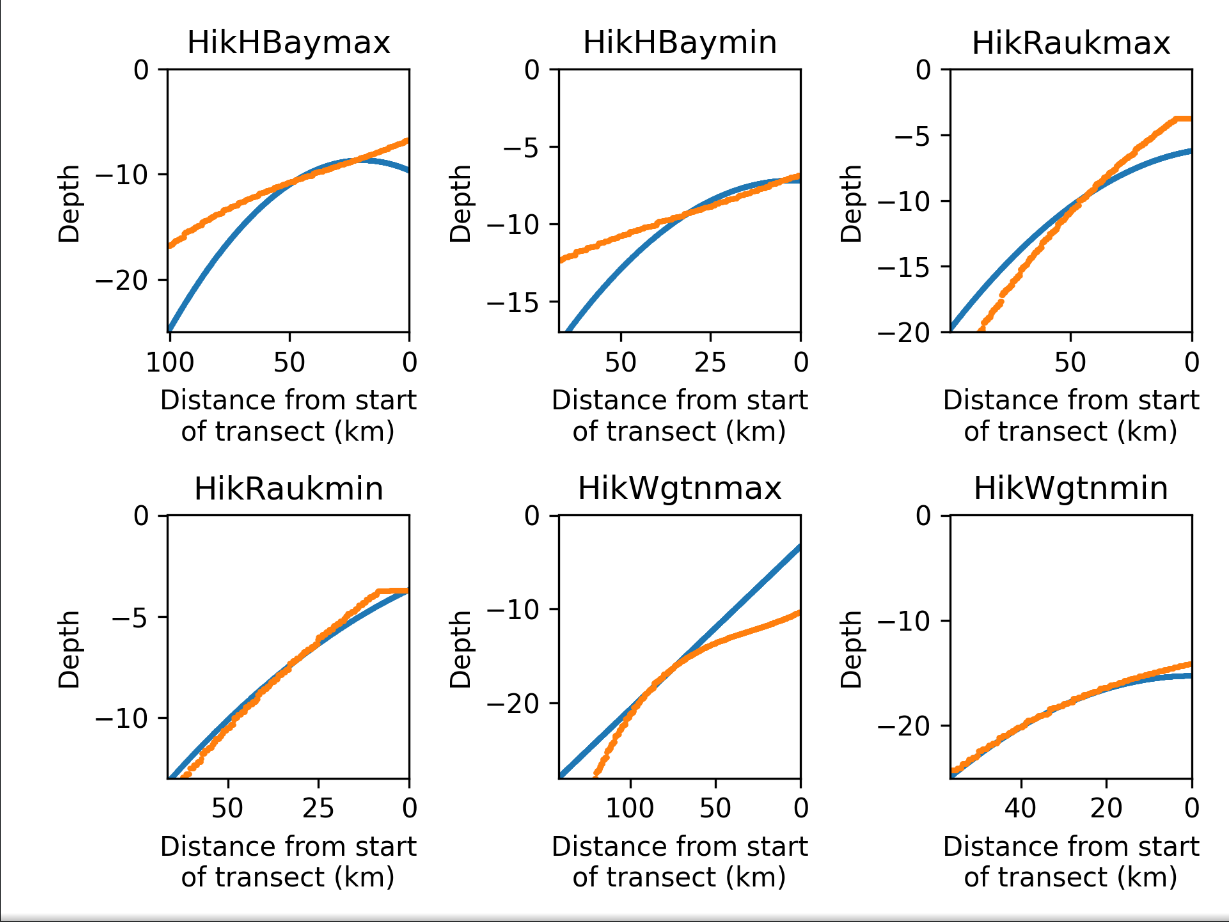
Current statusAs the HBay fault curvatures are clearly far too large (Resulting in small deformations) they were reduced by an order of magnitude. The current state of the deformations is visible below
The first four have worked relatively well. However Wgtnmax has not deformed at all, and Wgtnmin has deformed, much too far. The next step is to apply the appropriate dip to each fault and then a vertical shift to move them into alignment with the given surface. |

To increase the accuracy of the fault geometry the dip and depth of the fault should be changed to match that of the surface.
The dip was calculated by taking the leftmost and rightmost depths (Ignoring duplicate points such as those visible at the top of HikRaukmin) and calculating the dip angle.
The depth difference was calculated by taking the difference in depth at the center point.
| Fault | Dip | Depth | |
|---|---|---|---|
| Hbay | min | 4.65 | 0.33 |
| max | 5.65 | 1.47 | |
| Rauk | min | 9.29 | 2.47 |
| max | 11.44 | 1.97 | |
| Wgtn | min | 10.0 | 2.22 |
| max | 10.3 | 1.75 |
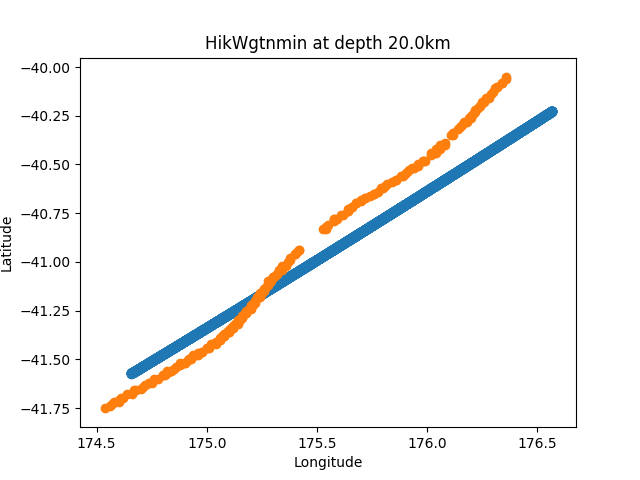
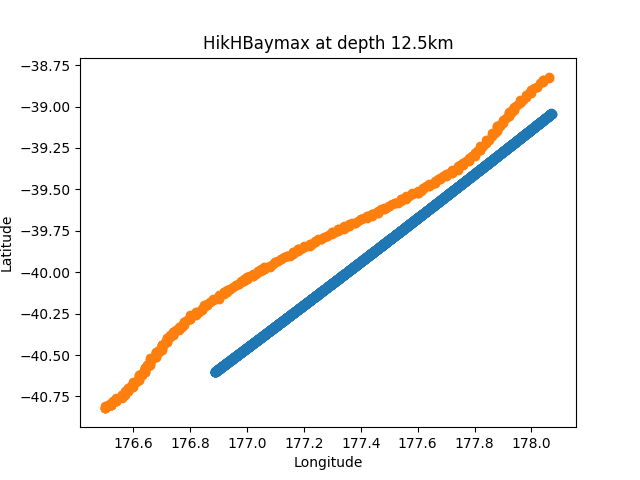
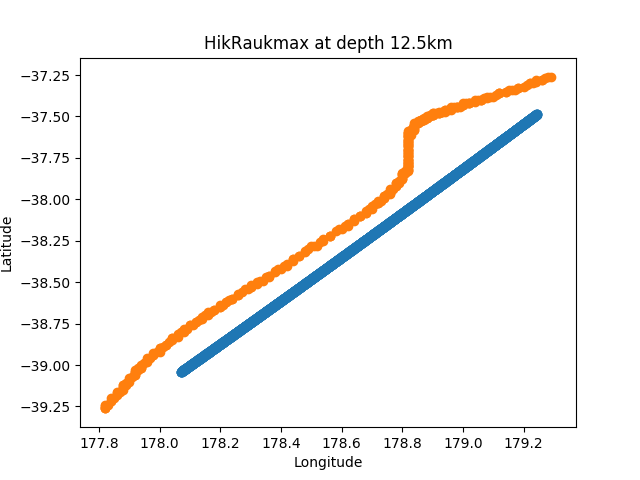
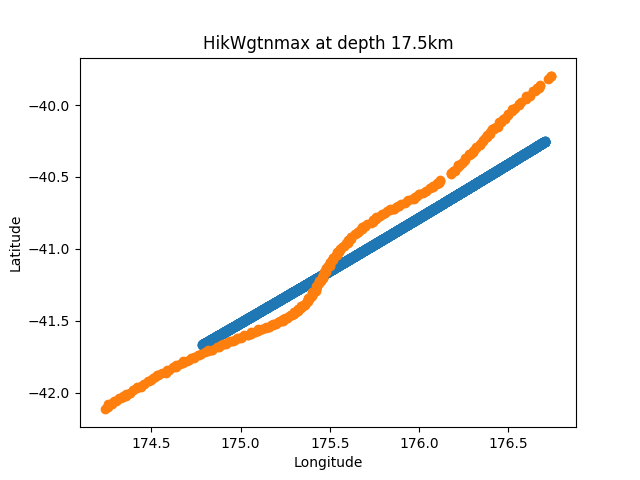
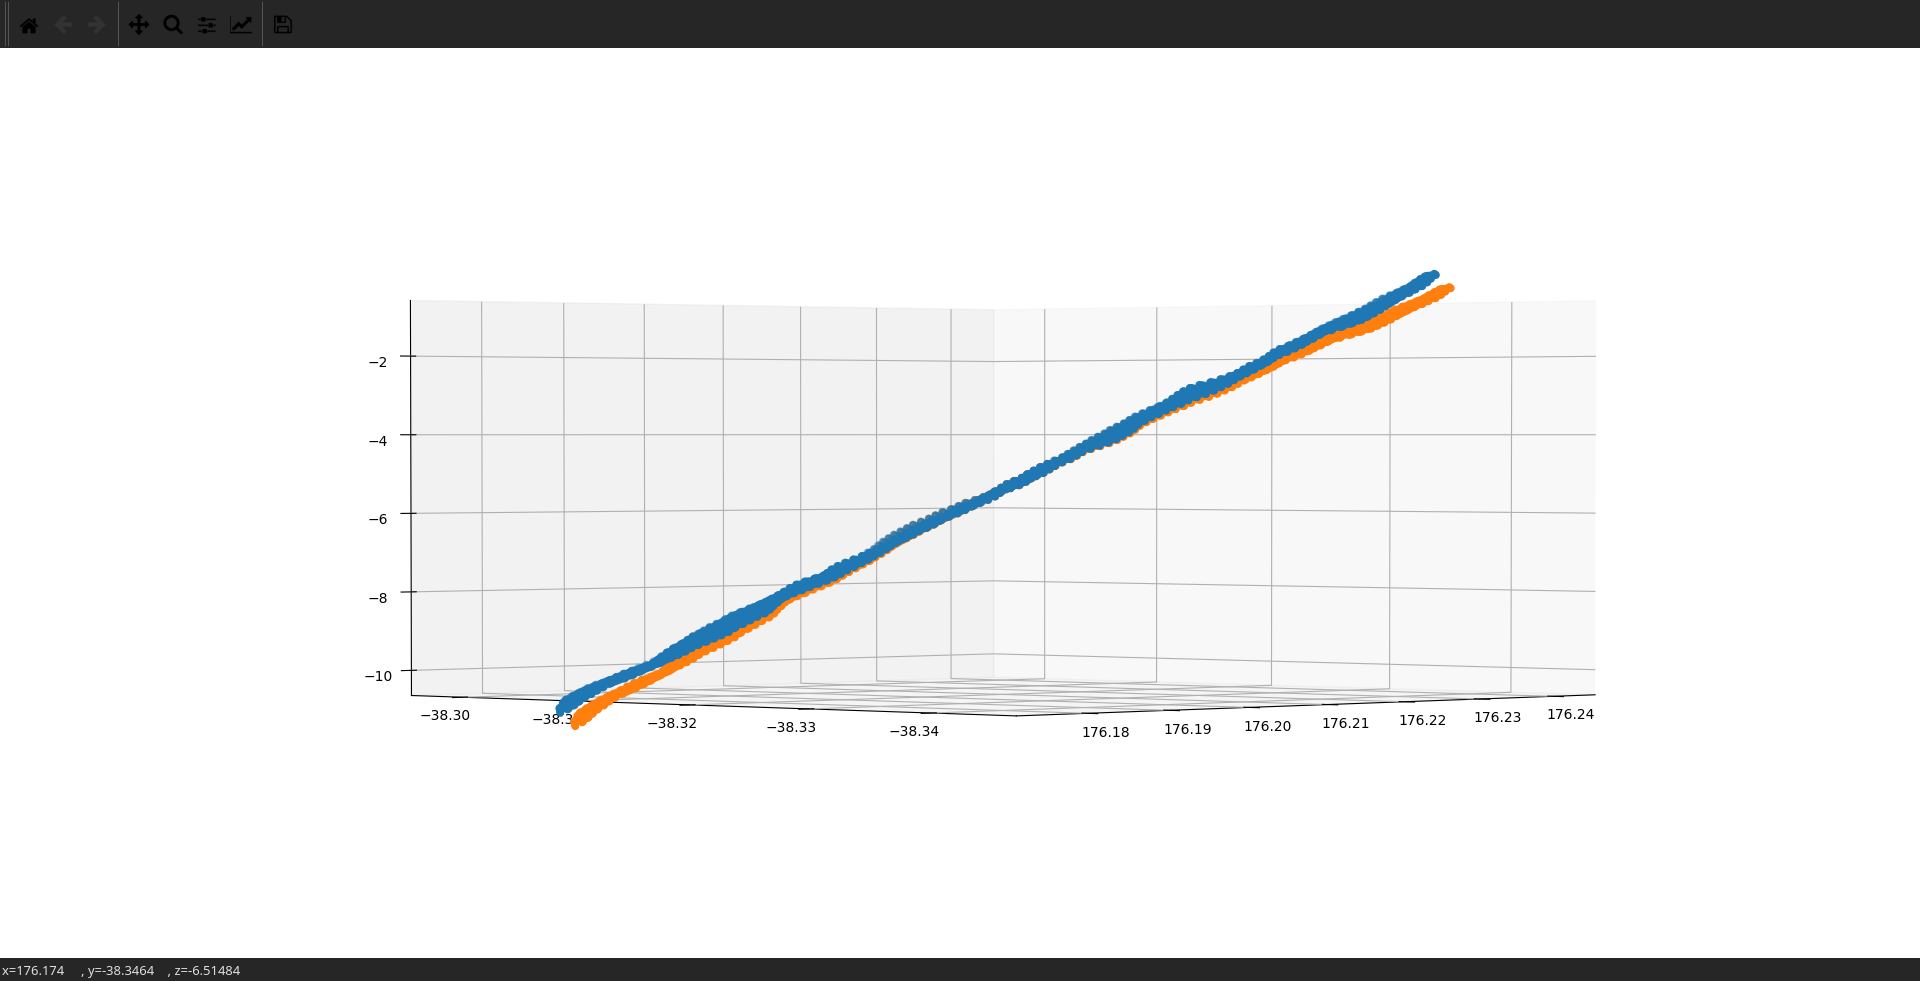
After applying these values the following changes were achieved:
The surface is in orange, while the srfs are in blue.
The bug resulting in Wgtnmax being translated/rotated but not curved has not yet been found.
Performance improvements have been made to allow for more rapid testing/debugging