Rupture
Magnitude of ruptures
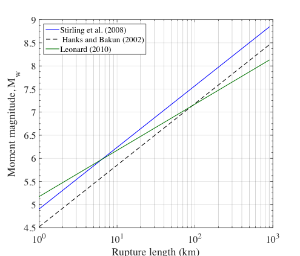
Test: Extract Mw for all ruptures from SRF.info, plot them versus area (i.e. Mw vs Area) and compare them with scaling relationships (e.g. the Leonard relationship (2011- Table 6)). Data should be colored based on the tectonic type (which indicates which scaling relationship should be used)
Pass criterion: Not passed yet.
Pass criterion: Not passed yet.
...
 |  |
|---|---|
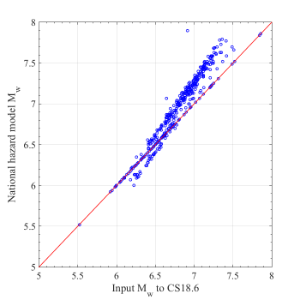
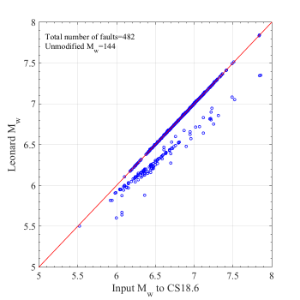
By using Leonard, we get smaller Mw with respect to MW from NHM for most of the faults, but not all. Those point below the red line coming from faults that they have small length but go down to seismogenic depth of 12 km. We increase the seismogenic depth to 15 for them, and this results in a larger Mw compared to Mw from NHM (calculated based on Stirling). The figure below is presented to explain this visually.
| Due to the mistake in the python code, the X-axis value of 144 points are larger than what it should have been. |
...