Below are plot comparisons between the old post-processing scripts that creates a db and Viktor’s new code https://github.com/ucgmsim/visualization/blob/master/comparisons/ that uses the new ascii format data. The two different methods uses the same input data located in /nesi/projects/nesi00213/dev/impp_datasets/Darfield/(sim|obs) from hypocentre.
| Plot Name | New Code | Old Code | Note |
|---|---|---|---|
Waveforms_sim_obs waveforms_sim_obs.py | 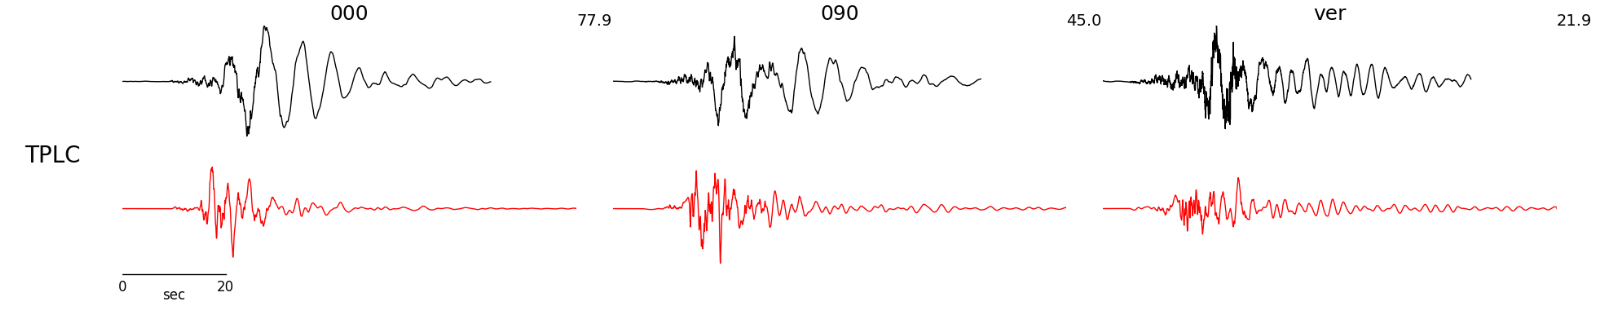 |  | New code shows one station on each plot. Functionalities to show multiple stations on one plot will be added later. |
pSA_geom_vs_period psa_sim_obs.py | 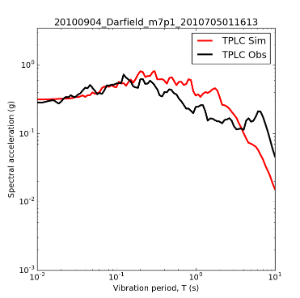 |  | |
Spectra_ratio_psa_geom psa_bias.py |  |  |
|
IM_ratio_vs_source_site_distance psa_ratios_rrup.py |  | 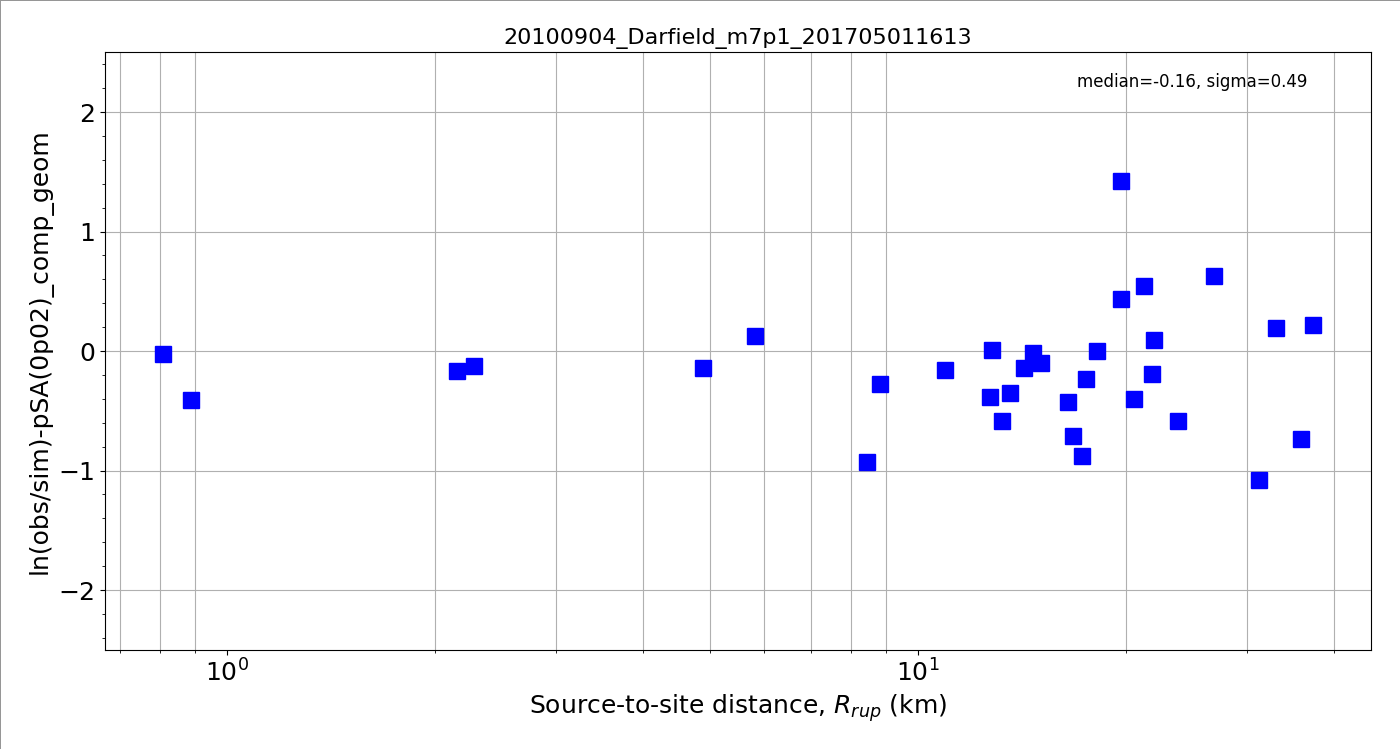 | The legend in the new plot will be converted to text when needed. |
IM_vs_source_site_distance im_rrup.py | 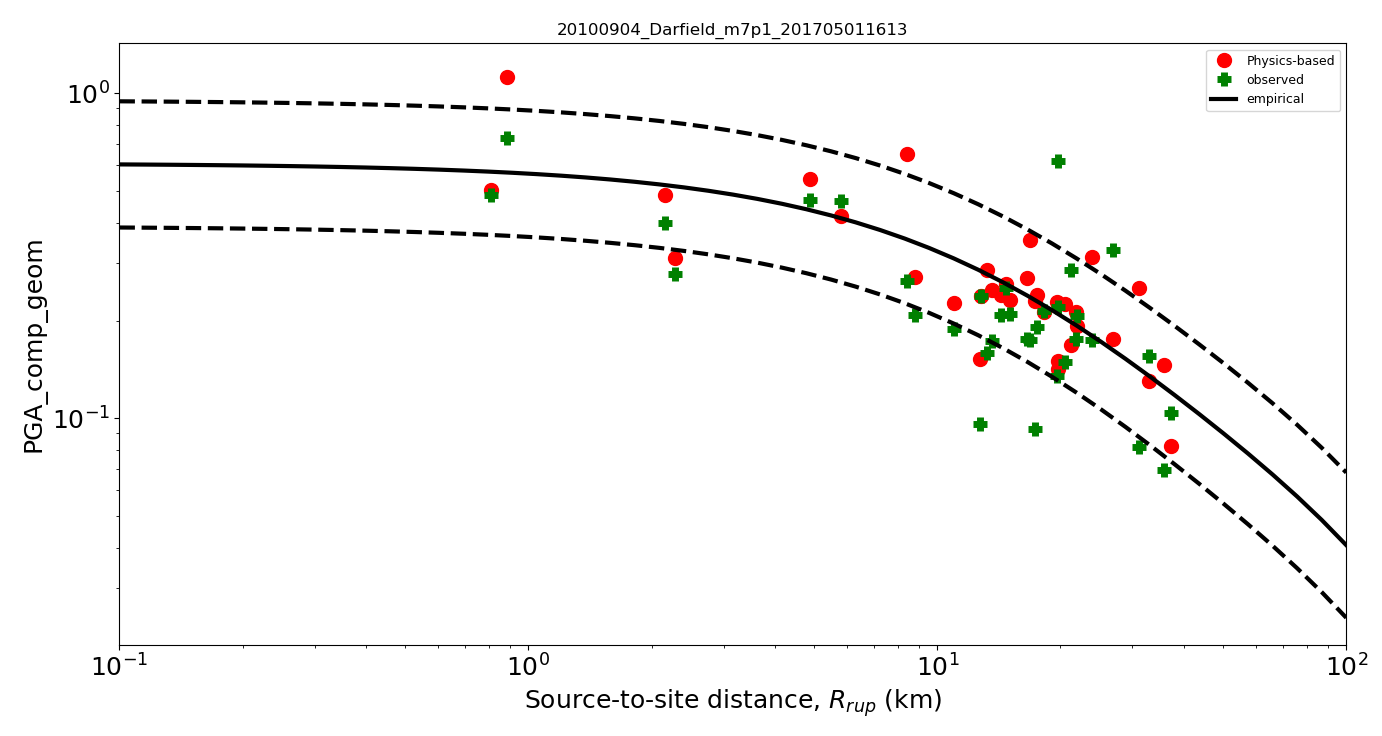 |  | |
IM Map Residual Plot (non_psa) psa_ratios.py |  | 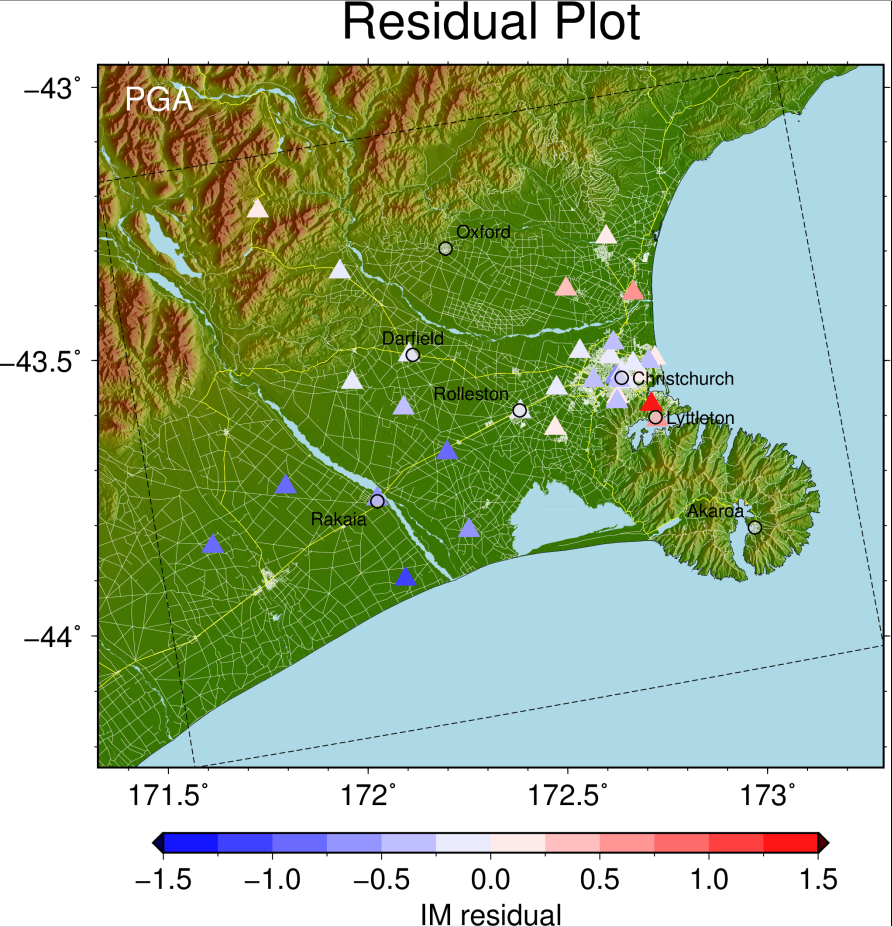 | Old plot missing a station
Old plot from /nesi/projects/nesi00213/dev/impp_datasets/darfield_output/Data/stat_ratios_IM_20100904_Darfield_m7p1_201705011613.xyz |
IM Map Residual Plot psa_ratios.py (psa) |  | 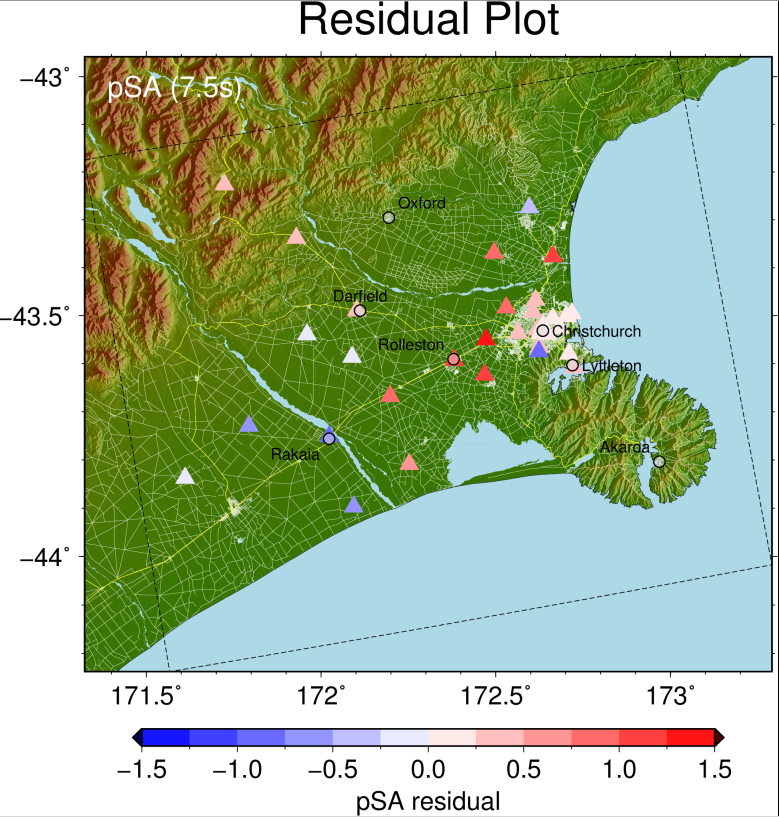 | Old plot missing a station Old plot from /nesi/projects/nesi00213/dev/impp_datasets/darfield_output/Data/stat_ratios_pSA_20100904_Darfield_m7p1_201705011613.xyz |
IM Map Obs IM Plot im_plot/im_plot.py | 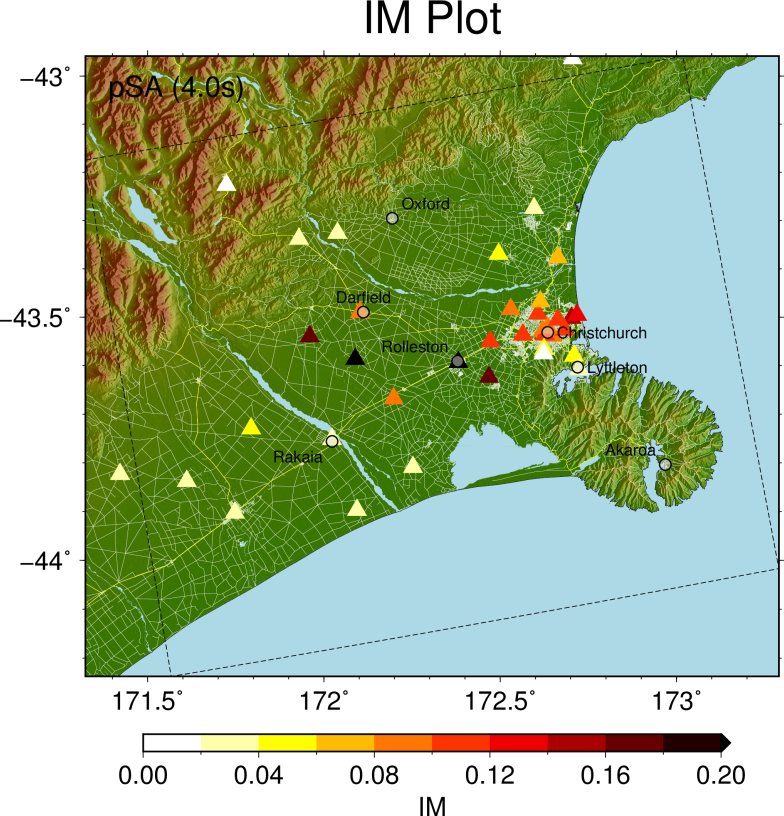 | 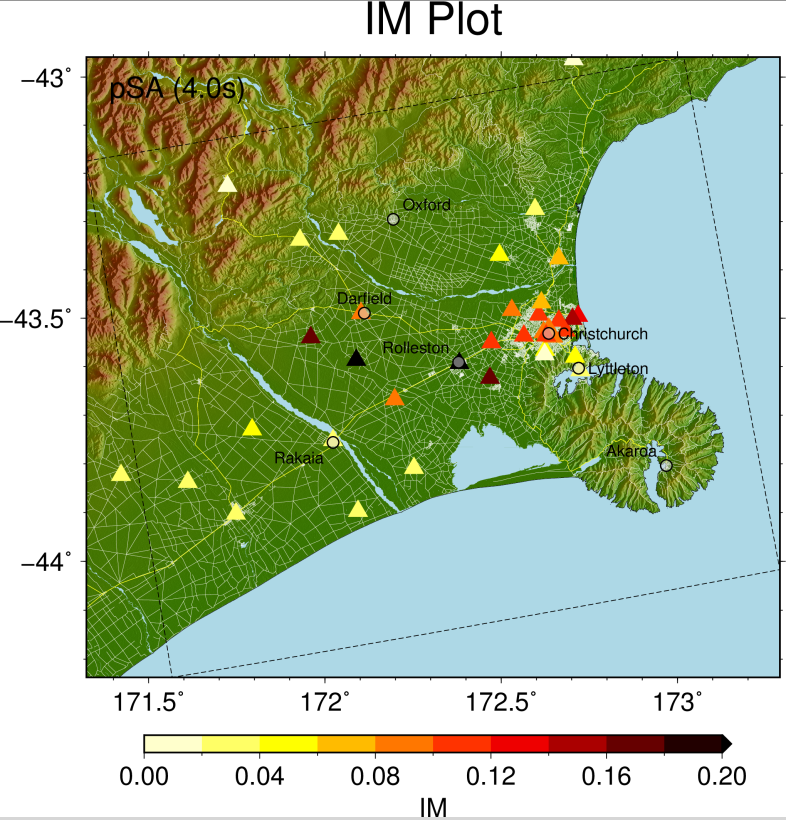 | Color scale difference between 0.00-0.02 Old plot not missing station if Old plot is from /nesi/projects/nesi00213/dev/impp_datasets/darfield_benchmark/Data/obs_im_plot_map_20100904_Darfield_m7p1_201705011613.xyz |
IM Map Sim IM Plot im_plot/im_plot.py |  | 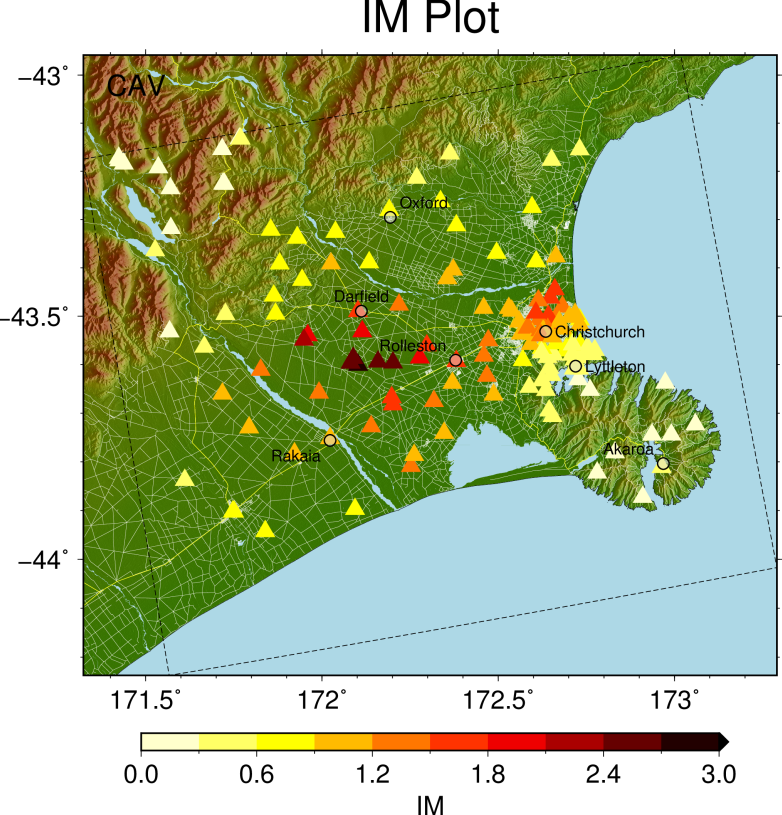 | Color scale difference between 0.0-0.6
Old plot from /nesi/projects/nesi00213/dev/impp_datasets/darfield_output/Data/sim_im_plot_map_20100904_Darfield_m7p1_201705011613.xyz |
IM Map Non-uniform Sim IM Plot im_plot/im_plot.py | 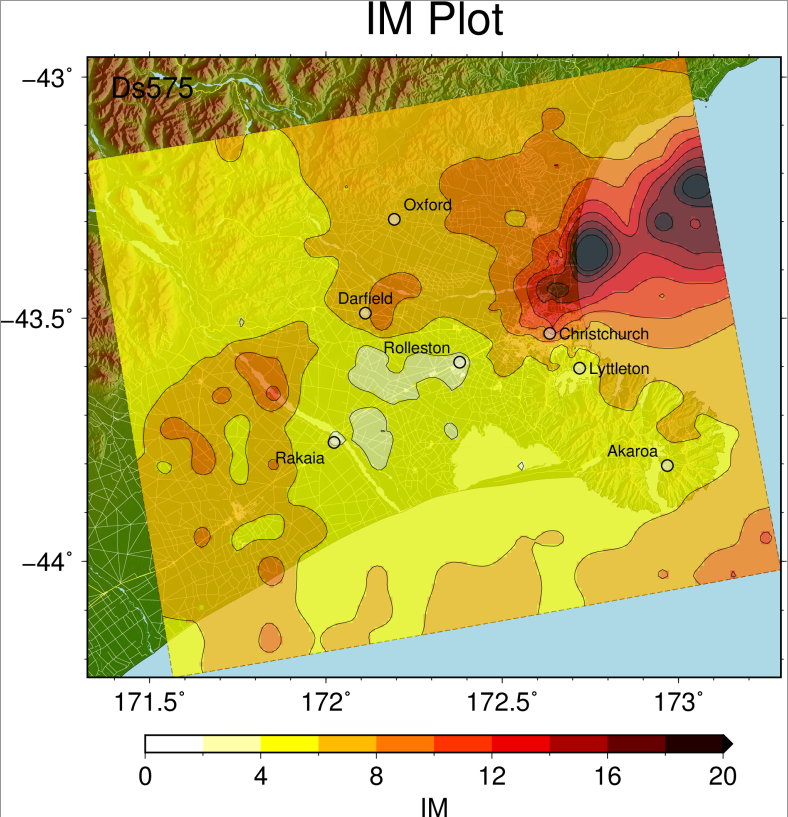 |  | Color scale same
Old plot from /nesi/projects/nesi00213/dev/impp_datasets/darfield_output/Data/nonuniform_im_plot_map_20100904_Darfield_m7p1_201705011613.xyz |
IM Map Non-uniform Emp IM Plot im_plot/im_plot.py | 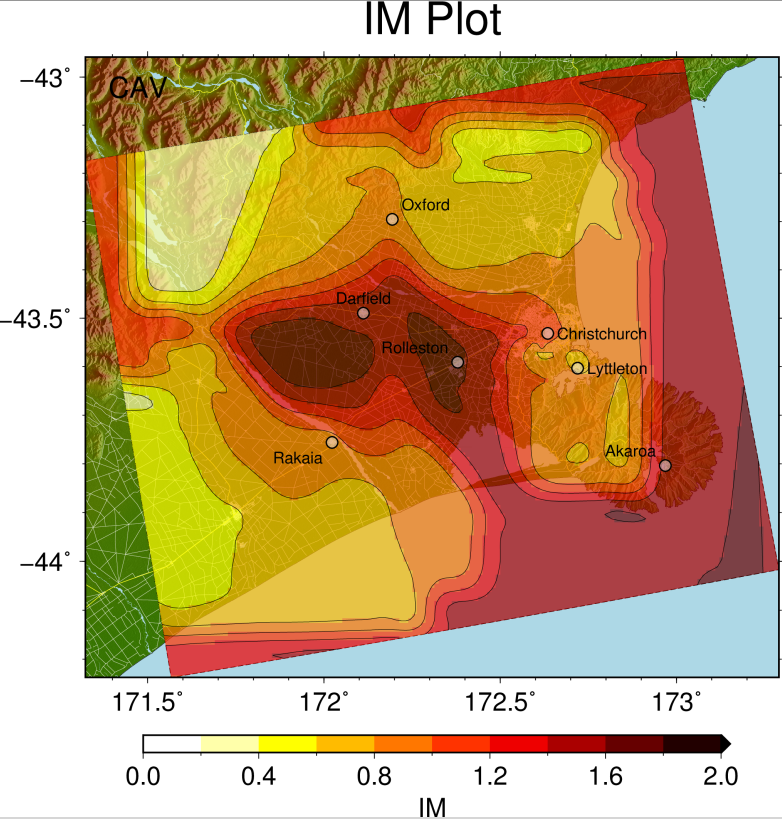 |  | New plot has contour lines empirical calculated using nesi/projects/nesi00213/dev/impp_datasets/Darfield/rrups.csv |
Todo: empirical plots when empirical data is ready